
MATLAB: An Introduction with Applications
6th Edition
ISBN: 9781119256830
Author: Amos Gilat
Publisher: John Wiley & Sons Inc
expand_more
expand_more
format_list_bulleted
Related questions
Question
Just need this stat problem solved
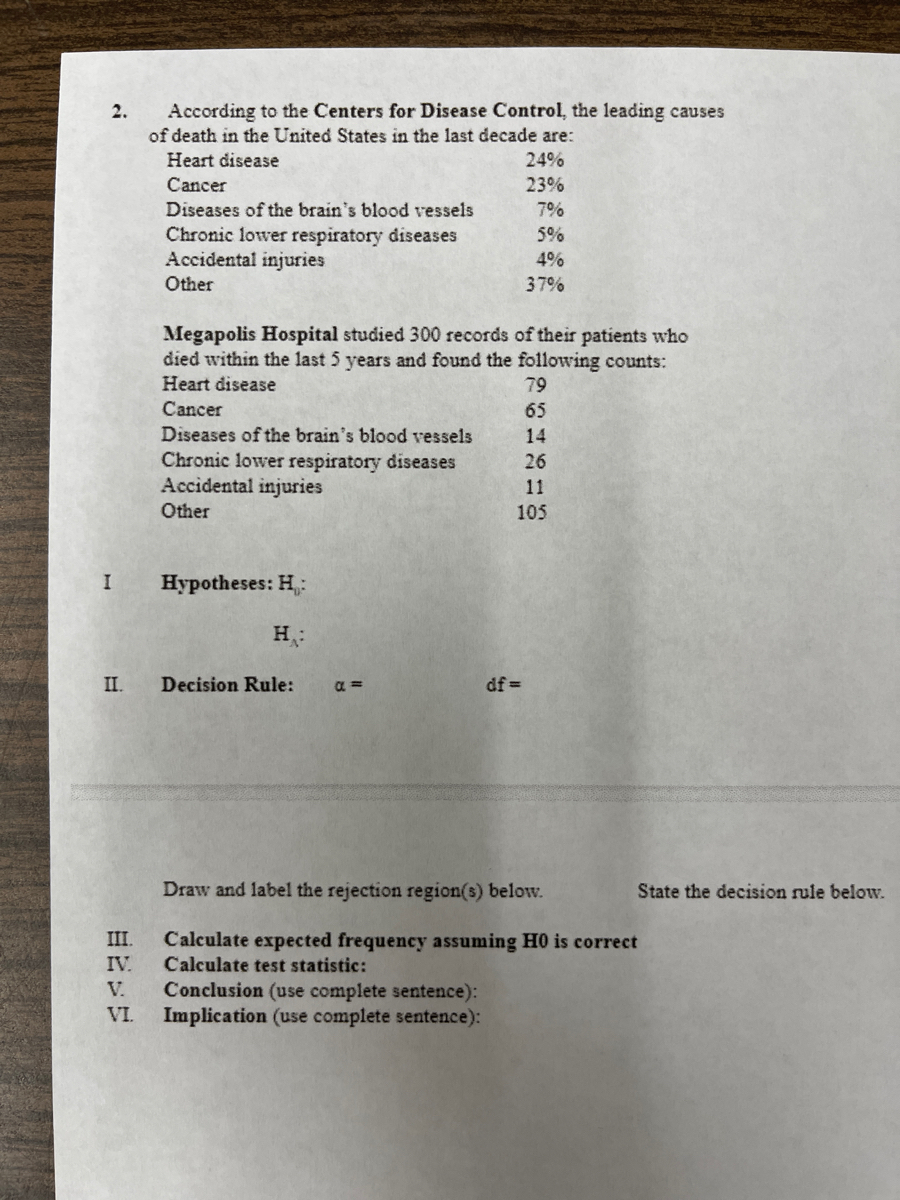

Transcribed Image Text:According to the Centers for Disease Control, the leading causes
of death in the United States in the last decade are:
2.
Heart disease
24%
Cancer
23%
Diseases of the brain's blood vessels
7%
Chronic lower respiratory diseases
Accidental injuries
Other
5%
4%
37%
Megapolis Hospital studied 300 records of their patients who
died within the last 5 years and found the following counts:
Heart disease
79
Cancer
65
Diseases of the brain's blood vessels
14
Chronic lower respiratory diseases
Accidental injuries
26
11
Other
105
Hypotheses: H,:
H:
II.
Decision Rule:
a =
df =
Draw and label the rejection region(s) below.
State the decision rule below.
Calculate expected frequency assuming H0 is correct
Calculate test statistic:
III.
IV.
V.
Conclusion (use complete sentence):
VI.
Implication (use complete sentence):
Expert Solution
This question has been solved!
Explore an expertly crafted, step-by-step solution for a thorough understanding of key concepts.

This is a popular solution

Trending nowThis is a popular solution!

Step by stepSolved in 2 steps

Knowledge Booster

Similar questions
- I am lost on what to do. I've tried to list what I know, but I got confused and have no leads. I'm working on Problem 3. Pleases help and show steps how to work out problem.arrow_forwardPlease help me better understand how to solve this word problem. In a study of 2000 model cars, a researcher computed the least-squares regression line of price (in collars) on horsepower. He obtained the following equation of: Price = -7000 + 170 X horsepower. Based on the least-squares regression line, what would we predict the cost of a 2000 model car with horsepower equal to 230 to be (assuming no extrapolation error)?arrow_forwardCellulon, a manufacturer of home insulation, wants to develop guidelines for builders and consumers on how the thickness of the insulation in the attic of a home and the outdoor temperature affect natural gas consumption. In the laboratory, it varied the insulation thickness and temperature. A few of the findings are: Monthly Natural Gas Consumption (cubic feet), Thickness of Insulation (inches), Outdoor Temperature (ºF), y x1 x2 30.3 6.0 40.0 24.2 12 40 27.9 8 49 On the basis of the sample results, the regression equation is: yˆy^ = 56.26 − 0.66x1 − 0.59x2 How much natural gas can homeowners expect to use per month if they install 6 inches of insulation and the outdoor temperature is 40 degrees F? (Round your answer to 2 decimal places.) What effect would installing 7 inches of insulation instead of 6 have on the monthly natural gas consumption (assuming the outdoor temperature remains at 40 degrees F)? (Round your answers…arrow_forward
- F1.6 Question 18 please write on paperarrow_forwardPlease show as much work as possible, and please do not skip steps. I really want to learn how to solve this, so if you use a axiom please include it. Problem Statement: One out of every one- thousand people have disease X. A new test for X is available, but it's not very accurate. If you have X, there is an 80% chance the test comes back positive and a 20% chance it comes back negative. If you don't have X, there is a 60% chance the test comes back negative and a 40% chance it comes back positive. Question: You are randomly chosen to be tested for X. Since the test is not very accurate, you areadministered the test 10 times; assume the outcomes of these 10 tests are independent. Sevenout of the 10 tests come back positive. Given these test results, what is the probability youhave X?arrow_forwardPison/&user=tmorrison7&key%3DrotNBBCzVIsGRqZV8t.. Previous Problem Problem List Next Problem (1 point) Empathy means being able to understand what others feel. To see how the brain expresses empathy, researchers recruited 16 couples in their midtwenties who were married or had been dating for at least two years. They zapped the man's hand with an electrode while the woman watched, and measured the activity in several parts of the woman's brain that would respond to her own pain. Brain activity was recorded as a fraction of the activity observed when the woman herself was zapped with the electrode. The women also completed a psychological test that measures empathy. Subject 1 3 4 7 8 9 10 11 12 13 14 15 16 Empathy Score 41 48 39 56 64 63 59 53 Brain Activity -0.127 0.3910.02 0.378 0.015 0.404 0.11 0.513 0.149 0.736 0.254 0.573 0.217 0.72 0.355 0.786 47 52 64 73 12 68 28 120 1.2 sub ject Z F20 10,0 120 -8.4 Given that the equation for the regression line is y = 0.00619x +0.00032, what is…arrow_forward
arrow_back_ios
arrow_forward_ios
Recommended textbooks for you
- MATLAB: An Introduction with ApplicationsStatisticsISBN:9781119256830Author:Amos GilatPublisher:John Wiley & Sons Inc
 Probability and Statistics for Engineering and th...StatisticsISBN:9781305251809Author:Jay L. DevorePublisher:Cengage Learning
 Statistics for The Behavioral Sciences (MindTap C...StatisticsISBN:9781305504912Author:Frederick J Gravetter, Larry B. WallnauPublisher:Cengage Learning
  Elementary Statistics: Picturing the World (7th E...StatisticsISBN:9780134683416Author:Ron Larson, Betsy FarberPublisher:PEARSON
 The Basic Practice of StatisticsStatisticsISBN:9781319042578Author:David S. Moore, William I. Notz, Michael A. FlignerPublisher:W. H. Freeman
 Introduction to the Practice of StatisticsStatisticsISBN:9781319013387Author:David S. Moore, George P. McCabe, Bruce A. CraigPublisher:W. H. Freeman
MATLAB: An Introduction with Applications
Statistics
ISBN:9781119256830
Author:Amos Gilat
Publisher:John Wiley & Sons Inc
Probability and Statistics for Engineering and th...
Statistics
ISBN:9781305251809
Author:Jay L. Devore
Publisher:Cengage Learning
Statistics for The Behavioral Sciences (MindTap C...
Statistics
ISBN:9781305504912
Author:Frederick J Gravetter, Larry B. Wallnau
Publisher:Cengage Learning
Elementary Statistics: Picturing the World (7th E...
Statistics
ISBN:9780134683416
Author:Ron Larson, Betsy Farber
Publisher:PEARSON
The Basic Practice of Statistics
Statistics
ISBN:9781319042578
Author:David S. Moore, William I. Notz, Michael A. Fligner
Publisher:W. H. Freeman
Introduction to the Practice of Statistics
Statistics
ISBN:9781319013387
Author:David S. Moore, George P. McCabe, Bruce A. Craig
Publisher:W. H. Freeman