1 2 Sample Size Sample Mean 2.4 3.1 Sample Variance 1.44 2.74 100 100 Find a 90% confidence interval for the difference in the mean numbers of police emergency calls per shift between the two districts of the city. (Use ₁-₂. Round your answers to two decimal places.) calls per shift to calls per shift Interpret the interval. O In repeated sampling, 90% of all intervals constructed in this manner will enclose the difference in the population mean number of police emergency calls per 8-hour shift between region 1 and region 2. Hence, we are fairly certain that this particular interval contains a difference in the population means from region 1 and region 2. O 90% of all values from the populations in region 1 and region 2 will fall within the interval. Hence, we are fairly certain that this particular interval contains a difference in the sample means from region 1 and region 2. O There is a 90% chance that for any two samples, one sample from region 1 and one sample from region 1, the difference between sample mean number of police emergency calls per 8-hour shift will fall within the interval. Hence, we are fairly certain that this particular interval contains a difference in the sample means from region 1 and region 2. O In repeated sampling, 10% of all intervals constructed in this manner will enclose the difference in the population mean number of police emergency calls per 8-hour shift between region 1 and region contains a difference in the population means from region 1 and region 2. Hence, we are fairly certain that this particular interval
1 2 Sample Size Sample Mean 2.4 3.1 Sample Variance 1.44 2.74 100 100 Find a 90% confidence interval for the difference in the mean numbers of police emergency calls per shift between the two districts of the city. (Use ₁-₂. Round your answers to two decimal places.) calls per shift to calls per shift Interpret the interval. O In repeated sampling, 90% of all intervals constructed in this manner will enclose the difference in the population mean number of police emergency calls per 8-hour shift between region 1 and region 2. Hence, we are fairly certain that this particular interval contains a difference in the population means from region 1 and region 2. O 90% of all values from the populations in region 1 and region 2 will fall within the interval. Hence, we are fairly certain that this particular interval contains a difference in the sample means from region 1 and region 2. O There is a 90% chance that for any two samples, one sample from region 1 and one sample from region 1, the difference between sample mean number of police emergency calls per 8-hour shift will fall within the interval. Hence, we are fairly certain that this particular interval contains a difference in the sample means from region 1 and region 2. O In repeated sampling, 10% of all intervals constructed in this manner will enclose the difference in the population mean number of police emergency calls per 8-hour shift between region 1 and region contains a difference in the population means from region 1 and region 2. Hence, we are fairly certain that this particular interval

College Algebra (MindTap Course List)
12th Edition
ISBN:9781305652231
Author:R. David Gustafson, Jeff Hughes
Publisher:R. David Gustafson, Jeff Hughes
Chapter8: Sequences, Series, And Probability
Section8.7: Probability
Problem 58E: What is meant by the sample space of an experiment?

Related questions
Question
I need help with all parts of this question 6
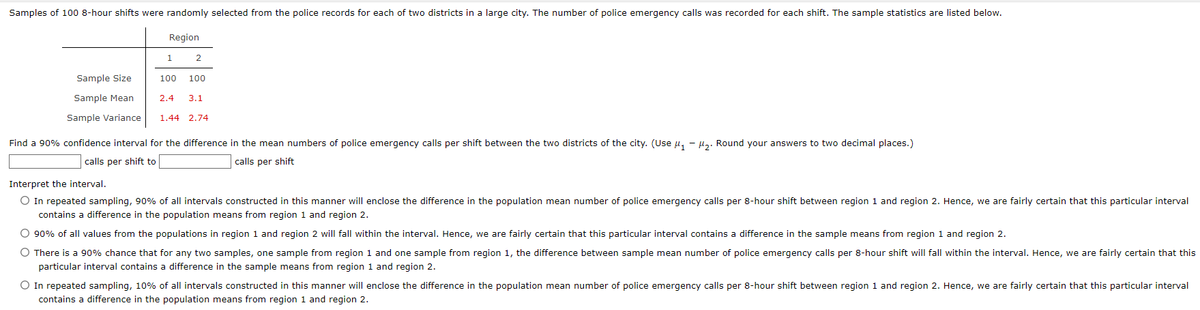
Transcribed Image Text:Samples of 100 8-hour shifts were randomly selected from the police records for each of two districts in a large city. The number of police emergency calls was recorded for each shift. The sample statistics are listed below.
Region
1
2
Sample Size
Sample Mean
2.4 3.1
Sample Variance 1.44 2.74
100 100
Find a 90% confidence interval for the difference in the mean numbers of police emergency calls per shift between the two districts of the city. (Use μ₁-2. Round your answers to two decimal places.)
calls per shift to
calls per shift
Interpret the interval.
O In repeated sampling, 90% of all intervals constructed in this manner will enclose the difference in the population mean number of police emergency calls per 8-hour shift between region 1 and region 2. Hence, we are fairly certain that this particular interval
contains a difference in the population means from region 1 and region 2.
O 90% of all values from the populations in region 1 and region 2 will fall within the interval. Hence, we are fairly certain that this particular interval contains a difference in the sample means from region 1 and region 2.
O There is a 90% chance that for any two samples, one sample from region 1 and one sample from region 1, the difference between sample mean number of police emergency calls per 8-hour shift will fall within the interval. Hence, we are fairly certain that this
particular interval contains a difference in the sample means from region 1 and region 2.
O In repeated sampling, 10% of all intervals constructed in this manner will enclose the difference in the population mean number of police emergency calls per 8-hour shift between region 1 and region 2. Hence, we are fairly certain that this particular interval
contains a difference in the population means from region 1 and region 2.
Expert Solution
This question has been solved!
Explore an expertly crafted, step-by-step solution for a thorough understanding of key concepts.

Step by step
Solved in 3 steps with 2 images

Recommended textbooks for you
College Algebra (MindTap Course List)
Algebra
ISBN:
9781305652231
Author:
R. David Gustafson, Jeff Hughes
Publisher:
Cengage Learning
College Algebra (MindTap Course List)
Algebra
ISBN:
9781305652231
Author:
R. David Gustafson, Jeff Hughes
Publisher:
Cengage Learning