#1-8: The average cost of four year public colleges is given below: Year 2000 2004 2006 2010 2013 2016 2019 Cost ($) 4,650 5,800 7,070 8,650 9,430 10,230 3,510 1) Use the data from 2006 and 2016 to write a linear equation for P(x), the average cost of Public college x years since 2000. Show your work and round values to the nearest dollar.


Contingency Table
A contingency table can be defined as the visual representation of the relationship between two or more categorical variables that can be evaluated and registered. It is a categorical version of the scatterplot, which is used to investigate the linear relationship between two variables. A contingency table is indeed a type of frequency distribution table that displays two variables at the same time.
Binomial Distribution
Binomial is an algebraic expression of the sum or the difference of two terms. Before knowing about binomial distribution, we must know about the binomial theorem.
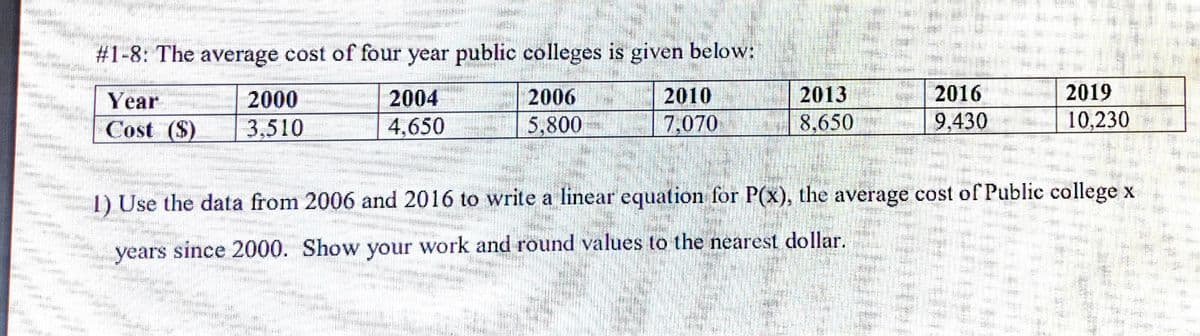
Use the data from 2006 and 2016
the x years since 2000
so for 2000, x=0
for 2006, x=6
for 2016, x=16
Average cost =
where m is the slope and b is the y intercept
to find out m we use slope formula
two points are

Step by step
Solved in 3 steps


