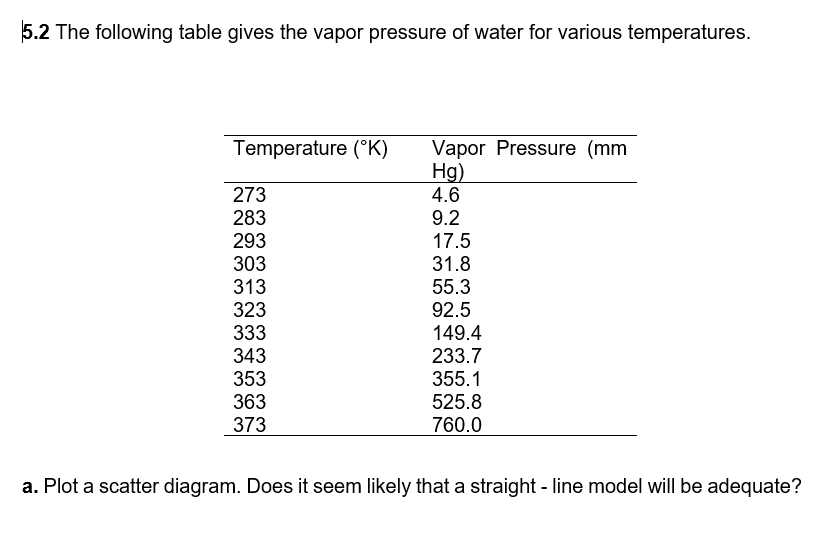
5.2 The following table gives the vapor pressure of water for various temperatures. Temperature (°K) Vapor Pressure (mm Hg) 273 4.6 283 9.2 293 17.5 303 31.8 313 55.3 323 92.5 333 149.4 343 233.7 353 355.1 363 525.8 373 760.0 a. Plot a scatter diagram. Does it seem likely that a straight-line model will be adequate?


Q: Per the following graph, explain the reason for every statistic that is calculated. For…
A: For the Covid vaccinations in Ontario, Mean=10725702 Median=12184937 Mode: 12649444, 12184937,…
Q: Assume that a sample is used to estimate a population mean . Find the 99.5% confidence interval for…
A:
Q: standardized exam's scores are normally distributed. In a recent year, the mean test score was 1515…
A: The exam score are normally distributed. The mean test score was 1515; μ=1515 The standard deviation…
Q: Plastic parts produced by an injection-molding operation are checked for conformance to…
A: Given data Each tool contains 11 cavities An officer chooses 1 part at random 3 cavities are…
Q: Given the plot of normal distributions A and B below, which of the following statements is true?…
A:
Q: Given the plot of normal distributions A and B below, which of the following statements is true?…
A:
Q: Suppose we measure the gasoline usage in kilometers per liter of three different makes of compact…
A: Given data: I II III 30 33 35 37 39 26 32 22 41 29 49 35 22 27 37 Significance level…
Q: For each conjecture, state the null and alternative hypothesis and determine whether the hypothesis…
A: Solution-: We want to state the null and alternative hypothesis and determine the whether the…
Q: Directions: Follow the steps in testing hypothesis to answer the following problems. a. Identify the…
A: a. Given that: μ=5.1x¯=6.03s =3.32n = 46 Level of significance, α=0.01
Q: 3. Powder milk is packed in 1-kilogram. An inspector from the Department of Trade and Industry (DTI)…
A: It is given that: x¯ sample average weight=0.96n sample size=40s sample SD=0.12μ0 claimed weight at…
Q: STATISTICS AND PROBABILITY (Answer only. NO long explanation needed. Rate will be given) Choose…
A:
Q: STATISTICS AND PROBABILITY (Answer only. NO long explanation needed. Rate will be given) a. Find…
A:
Q: What is the independent variable in a correlational study of amounts of sunlight and the heights of…
A:
Q: Testing Hypothesis A company that makes cola drinks states that the mean caffeine content per 12-…
A:
Q: Three dice were rolled. Find the probability of getting a number less than 10 if it is known that…
A: Given information: No. of dice=03P(x<10)=?
Q: STATISTICS AND PROBABILITY (Answer only. NO long explanation needed. Rate will be given) ANSWER IN…
A: Let Z be the random variable from standard normal distribution with mean = 0 and variance = 1
Q: ONE SAMPLE t-Test exercise: Pushups-comparing female college students average to female national…
A: Given, Give test a sample of female college students. Use their sample mean to estimate the…
Q: 5.3 The data shown below present the average number of surviving bacteria in a canned food product…
A: Solution-: Let, X=Minutes of exposure and Y= Number of bacteria We have following data: X:…
Q: 5.3 The data shown below present the average number of surviving bacteria in a canned food product…
A: Given data: Number of Bacteria Minutes of Exposure 175 1 108 2 95 3 82 4 71 5 50 6…
Q: Test whether the number of European-made cars differs from 4000 pounds. Use 0.5 level of…
A: According to the given countries in the list, the European countries are - Germany, Italy, UK and…
Q: Question 3 A sample of 44 commuters in Chicago showed the average of the commuting times was 33.2…
A: "Since you have asked multiple questions, we'll solve the first question for you. If you want any…
Q: ABC manufacturing company producing 6000 steel cylinders operators. The Quality Control department…
A: Sampling Methods for conducting the survey Data are the basic material needed for effective…
Q: Target Topic: Improve scores in Mathematics examination for students who participated in Special…
A:
Q: The relationship between confidence interval and hypothesis testing is very close. Do you agree?…
A: Note: As per the guidelines if multiple questions are posted only first question should be answered.…
Q: are unknown. We wish to test the hypotheses Ho: o² = 0 vs. Ha: 0² 0 at the level a. Show that the…
A:
Q: 3. The following data shows the results of 4 students in a 50-item multiple choice exam: 47, 36, 42,…
A: Formula : range=maximum - minimum
Q: a. What is the expected weekly demand for the alarm clock radio? b. What is the variance and…
A: The provided information is x (weekly demand) Probability p(x) x*p(x) x2*p(x) 0 0.05 0 0 1…
Q: The local coffee shop keeps track of how much coffee they sell versus the temperature on that day,…
A:
Q: written as
A: A null hypothesis is a simple and positive statement.
Q: onent. Determine the moment exerted about the steering column at O.
A:
Q: Six girls and five boys wish to join a ski trip. Four of them will be selected at random. What is…
A: Six girls and five boys wish to join a ski trip. Four of them will be selected at random. What is…
Q: 190 150 195 163 210 140 180 156 200 148 143 124 149 125 240 170 158 133 235 165 169 135 192 160 170…
A: *Answer: Step 2 A) The general form of regression line is given as: y=a+bx where a is the…
Q: 5 example pairs of dependent and independent variable example: price of cake (dependent) - size of…
A: Here we have to give 5 example pairs of dependent and independent variable Dependent variable: The…
Q: Suppose a population distribution has a mean of 86.1 and a a random sample of 83 observations from…
A: The following information has been given: The sample size is n=83. The population mean is μ=86.1.…
Q: X is a random variable with mean and variance Hand o² The x-μ standardized form of X is Z= what are…
A: Given that By design and definition, Z always has a mean of 0 and a standard deviation = 1 since…
Q: The following table presents the daily high temperatures for the city of Macon, Georgia, in degrees…
A:
Q: Twenty-nine executives reported the number of telephone calls made during a randomly selected week…
A: Given Max call=58 Min call=3
Q: Question 7 For the following information x 43 48 56 61 128 120 y 135 143 (a) Estimate the sample…
A: Note: As per guidelines we are supposed to solve only first three subparts. Please repost the other…
Q: The standard deviation of the fuel consumption of a certain car is hypothesized to be equal to 1.72…
A: As per our guidelines we can solve first three sub part of question and rest can be reposted.…
Q: Ten soldiers participated in a shooting competition in the first week. After intensive training they…
A: Given data: Score before 67 24 57 55 63 54 56 68 33 43 Score after 70 38 58 58 56 67 68 75 42…
Q: STATISTICS AND PROBABILITY (Answer only. NO long explanation needed. Rate will be given) Which of…
A:
Q: The average price of a personal computer is $949. If the computer distributed with a standard…
A:
Q: STATISTICS AND PROBABILITY (Answer only. NO long explanation needed. Rate will be given) Which of…
A: We have to identify Which of the following represents this graph of a standard normal distribution?…
Q: STATISTICS AND PROBABILITY (Answer only. NO long explanation needed. Rate will be given) Let Z be…
A: Z be a standard normal variable with mean zero and variance 1
Q: Test 1: Multiple Linear Regression. Given the following data: y X₁ X₂ X3 X4 X5 8.0 19.6 94.9 2.3 5.2…
A: Since we only answer up to 3 sub-parts, we’ll answer the first 3. Please resubmit the question and…
Q: Statistic use A. Z com = -1 Z tab=2.575 Z tab=-2.575 39. What will be the decision? A. Reject Ho B.…
A: Note : As per answering guidelines I have to only one question in case of multiple different…
Q: STATISTICS AND PROBABILITY (Answer only. NO long explanation needed. Rate will be given) Which of…
A: The given graph is normal probability distribution. The probability density curve of normal…
Q: If the maximum error with 0.99 probability is 0.25 and a sample size 400, then the standard…
A: It is given that Maximum error, E = 0.25 Sample size = 400
Q: A multiple-choice examination has 11 questions, each with five possible answers, only one of which…
A:
Q: 3. The following data shows the results of 4 students in a 50-item multiple choice exam: 47, 36, 42,…
A: Formula :


Trending now
This is a popular solution!

Step by step
Solved in 2 steps with 1 images

- Find the equation of the regression line for the following data set. x 1 2 3 y 0 3 4he following data are measurements of temperature (x = °F) and chirping frequency (y = chirps per second) for the striped ground cricket. Temperature 31.4 22.0 34.1 29.1 27.0 24.0 20.9 27.8 Frequency 20.0 16.8 19.9 18.2 17.4 15.5 14.6 17.4 Temperature 20.8 28.5 26.4 28.1 27.0 28.6 24.6 Frequency 15.3 16.1 15.3 17.8 16.3 17.1 14.3 Find the best-fitting line for the data. (Round your values to three decimal places.Consider the following data relating hours spent studying (X) and average grade on course quizzes (Y): X Y 5 6 3 8 4 8 7 10 5 7 6 9 Compute SP (equation below) 420 5 6 17
- A study is made of the relationship between annual production volume of Good A and factory floor area. Table below shows the data from a sample of 10 factories. Factory Factory floor area, X (‘000m2 ) Annual production volume, Y ($‘ 000) 1 40 3.5 2 600 25.0 3 60 4.8 4 72 3.5 5 400 30.0 6 90 5.0 7 200 12.0 8 70 4.5 9 80 5.0 10 84 6.0 Construct a scatter plot.Q1 A) List down the measures of central tendency and measures of dispersion 2) The operations manager of a plant that manufactures tires wants to compare the actual inner diameters of two grades of tires, each of B) which is expected to be 575 millimeters. A sample of five tires of each grade was selected, and the results representing the inner diameters of the tires, ranked from smallest to largest, are as follows. Grade X grade Y 568 570 575 578 584 573 574 575 577 578 requirement. a) for each of the tow grades of tries, compute the mwan, median, and standred deviation. b) which grade of tire providing better quality? explain. c) what would be the effect on your answer in (a) and (b) if the last value for grade Y were 588 insert 578 explain. C) The file contins the overall miles per gallon (MPG) OF 2010 family sedan: 24 21 22 23 24 34 34 34 20 20 22 22 44 32 20 20 22 20 39 20 Source:…Suppose μ1 and μ2 are true mean stopping distances at 50 mph for cars of a certain type equipped with two different types of braking systems. The data follows: m = 8, x = 114.6, s1 = 5.03, n = 8, y = 129.3, and s2 = 5.38. Calculate a 95% CI for the difference between true average stopping distances for cars equipped with system 1 and cars equipped with system 2. (Round your answers to two decimal places.) ,
- 1. The following data has been collected to determine if a relationship exists between the amountof snowfall in Toronto and the number of students who attend lecture at U of T.Year Snowfall, x (cm) Number of students in class, y1995 173 1821996 165 1901997 152 2071998 184 1801999 178 184a. Determine the line of best fit by creating a scatter plot in Excel, a trendline, and thecorrelation coefficient. Make sure your scatter plot is properly titled and formatted.b. Explain what this correlation tells you about the relationship between the amount ofsnowfall and the number of students who attend lecture.c. How many students could we expect to attend a lecture if it were to snow 160 cm in aseason. Is this an example of interpolation or extrapolation?A glass manufacturing company wanted to investigate the effect of breakoff pressure and stopper height on the percentage of breaking off chips. The results are in the accompanying table. Complete parts (a) through (e). a. At the 0.01 level of significance is there an interaction between the breakoff pressure and the stopper height? b. is there an effect due to the breakoff pressure? c. is there an effect due to the stopper height? d. Plot the percentage breakoff for each breakoff pressure for each stopper height. e. Discuss the results of (a) through (d).The director of an alumni association wants to determine whether there is any type of relationship between the amount of an alumni's contribution (in dollars) and the number of years the alumnus has been out of school. Based on the data below, decide if the correlation between the number of years and the amount of the contribution is significant at the alpha value of 0.05. Years x 1 3 5 10 6 9 Contribution y 640 290 170 45 70 80 a) Determine the line of best fine y = a + bx b) When x = 8 what is y and what does it mean in this context.
- Consider the following data relating hours spent studying (X) and average grade on course quizzes (Y): X Y 5 6 3 8 4 8 7 10 5 7 6 9 From these observations, can we conclude that hours spent studying caused increases in quiz grades?1.Consider the accompanying data on and (%) at failure of the cheese. [Note: Theresearchers were Italian and used real mozzarella cheese, not the poor cousin widelyavailable in the United States.]a. Construct a scatter plot.b. What does the plot suggest about the nature of the relationship between the twovariables?c. Calculate coefficient of correlation between x and y. Comment on the result. 2.Scraps of iron were selected on the basis of their densities, x, and their iron contents, y,were measured. The results were as follows:x 2.8 2.9 3.0 3.1 3.2 3.2 3.2 3.3 3.4y 27 23 30 28 30 32 34 33 30(i) Plot the data(Scatter Diagram)9 | P a g e(ii) Find the regression equation of y on x by the method of least squares(iii) Comment on Goodness of fit of the fitted line(iv) Predict y for given x=3.5A major credit card company is interested in whether there is a linear relationship between its internal rating of a customer’s credit risk and that of an independent rating agency. The company collected a random sample of 200 customers and used the data to test the claim that there is a linear relationship. The following hypotheses were used to test the claim. H0:β1=0Ha:β1≠0 The test yielded a t-value of 3.34 with a corresponding p-value of 0.001. Which of the following is the correct interpretation of the p-value? If the alternative hypothesis is true, the probability of observing a test statistic at least as extreme as 3.34 is 0.001. If the alternative hypothesis is true, the probability of observing a test statistic at least as extreme as 3.34 is 0.001. A If the alternative hypothesis is true, the probability of observing a test statistic of 3.34 or greater is 0.001. If the alternative hypothesis is true, the probability of observing a test statistic of 3.34 or greater…
