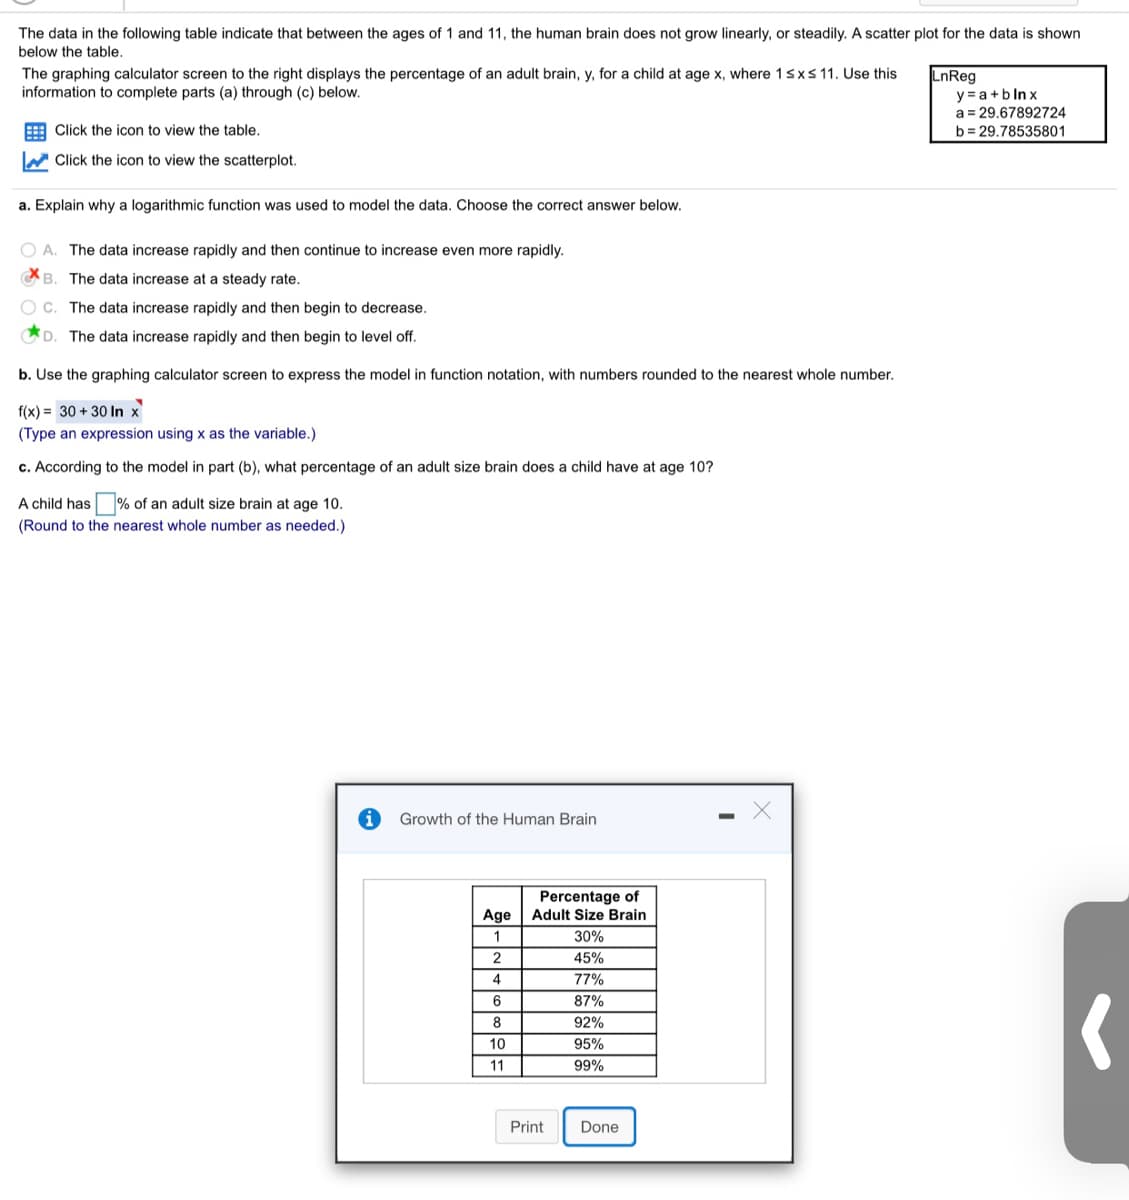
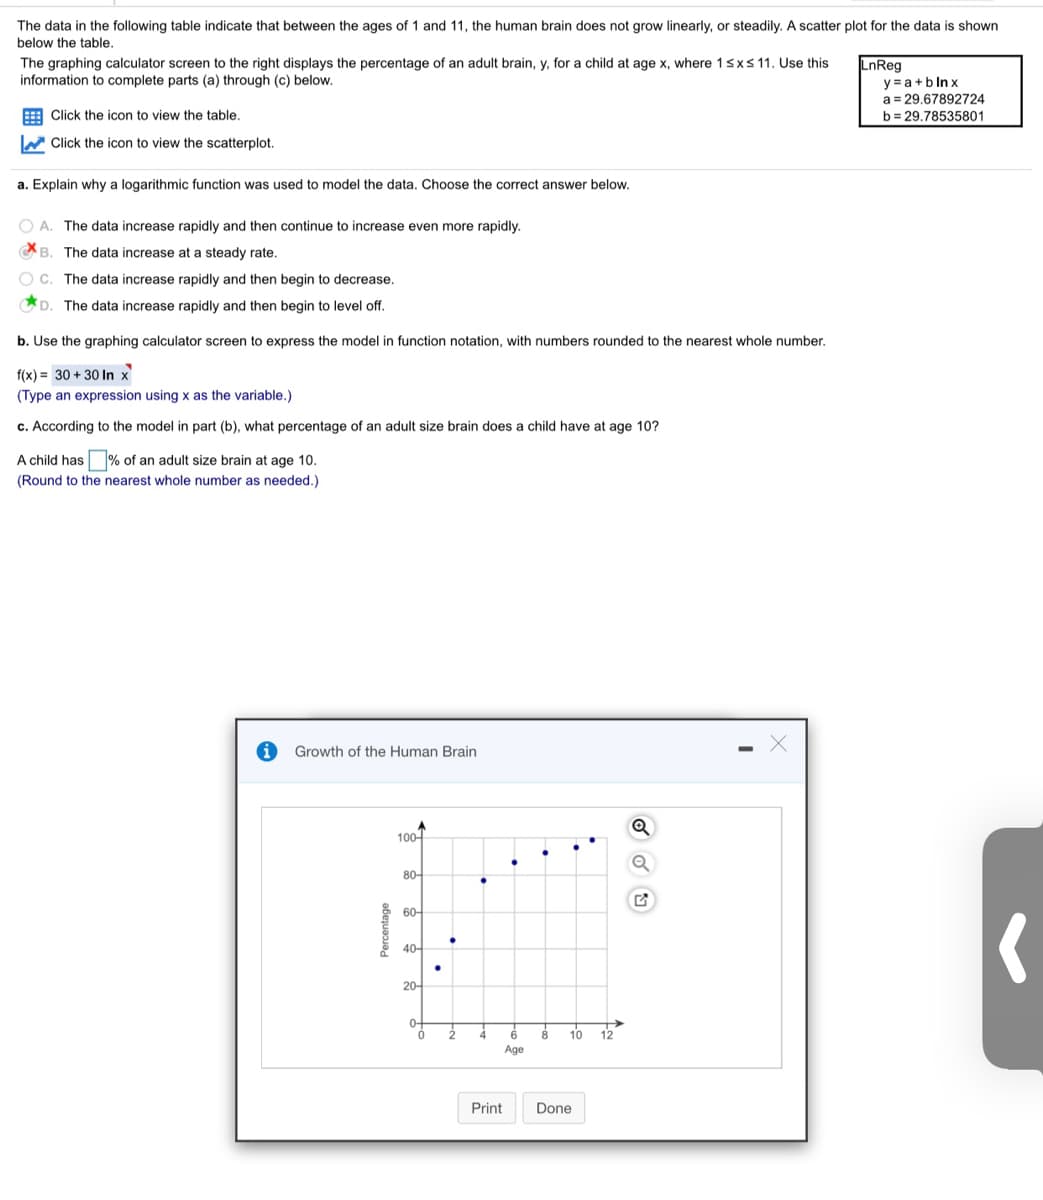
The data in the following table indicate that between the ages of 1 and 11, the human brain does not grow linearly, or steadily. A scatter plot for the data is shown below the table. The graphing calculator screen to the right displays the percentage of an adult brain, y, for a child at age x, where 1sxs 11. Use this information to complete parts (a) through (c) below. LnReg y = a+b ln x a = 29,67892724 E Click the icon to view the table. b= 29.78535801 W Click the icon to view the scatterplot. a. Explain why a logarithmic function was used to model the data. Choose the correct answer below. O A. The data increase rapidly and then continue to increase even more rapidly. B. The data increase at a steady rate. C. The data increase rapidly and then begin to decrease. D. The data increase rapidly and then begin to level off. b. Use the graphing calculator screen to express the model in function notation, with numbers rounded to the nearest whole number. f(x) = 30 + 30 In x (Type an expression using x as the variable.) c. According to the model in part (b), what percentage an adult size brain does a have at age 10? A child has % of an adult size brain at age 10. (Round to the nearest whole number as needed.) Growth of the Human Brain Percentage of Adult Size Brain Age 30% 45% 4 77% 87% 8. 92% 10 95% 11 99% Print Done


Unitary Method
The word “unitary” comes from the word “unit”, which means a single and complete entity. In this method, we find the value of a unit product from the given number of products, and then we solve for the other number of products.
Speed, Time, and Distance
Imagine you and 3 of your friends are planning to go to the playground at 6 in the evening. Your house is one mile away from the playground and one of your friends named Jim must start at 5 pm to reach the playground by walk. The other two friends are 3 miles away.
Profit and Loss
The amount earned or lost on the sale of one or more items is referred to as the profit or loss on that item.
Units and Measurements
Measurements and comparisons are the foundation of science and engineering. We, therefore, need rules that tell us how things are measured and compared. For these measurements and comparisons, we perform certain experiments, and we will need the experiments to set up the devices.


Trending now
This is a popular solution!

Step by step
Solved in 2 steps with 1 images


