(1) Calculate the following variances between the budgeted contribution margin and the actual contribution margin for May. Assume that all raw material purchased during May was placed into production. Provide all steps of calculations. (a) direct labour rate variance (b) direct labour efficiency variance (c) direct material price variance (d) direct material quantity variance (e) variable overhead spending variance (f) variable overhead efficiency variance (g) sales price variance (h) sales volume variance (5) Prepare a revised contribution margin report showing proper variable cost variances based on a flexible budget instead of the static budget used by Robert Smith. Use the following format: Static Flexible Actual Variance Budget Budget Units Revenue Variable costs: Direct material Housing units Printed circuit boards Reading Heads Total direct material Direct labour Assembly Printed circuit boards Reading Heads Total direct labour Variable overhead Total variable costs Contribution margin CAN YOU PLEASE SOLVE QUESTION 1. E AND F ALSO QUESTION 5 PLEASE !!!


Video Tech Ltd manufactures video game machines. Market saturation and technological
innovations have caused pricing pressures that have resulted in declining profits. To stem the
slide in profits until new products can be introduced, top management has started to focus on
achieving cost savings in manufacturing and increases in sales volume. Sales can be increased
only if production volume increases. Therefore, an incentive program has been developed to
reward those production managers who contribute to an increase in the number of units
produced and achieve cost reductions. In addition, a just-in-time purchasing program has been
implemented, and raw materials are purchased on an as-needed basis.
The production managers have responded to the pressure to improve manufacturing
performance and this has resulted in an increase in the number of completed units over normal
production levels. The video game machines are put together by the assembly group, which
requires parts from both the printed circuit boards (PCB) and the reading heads (RH) groups.
To increase production levels, the PCB and RH groups started to reject parts that previously
would have been tested and modified to meet manufacturing standards. Preventative
maintenance on machines used in the production of these parts has been postponed, with only
emergency repair work being performed to keep production lines moving. The maintenance
department is concerned that there will be serious breakdowns and unsafe operating conditions.
The more aggressive assembly group production supervisors have pressured maintenance
personnel to attend to their machines at the expense of other groups. This has resulted in
machine downtime in the PCB and RH groups which, when coupled with demands for
accelerated parts delivery by the assembly group, has led to more frequent parts rejections and
increased friction between departments. Video Tech uses a
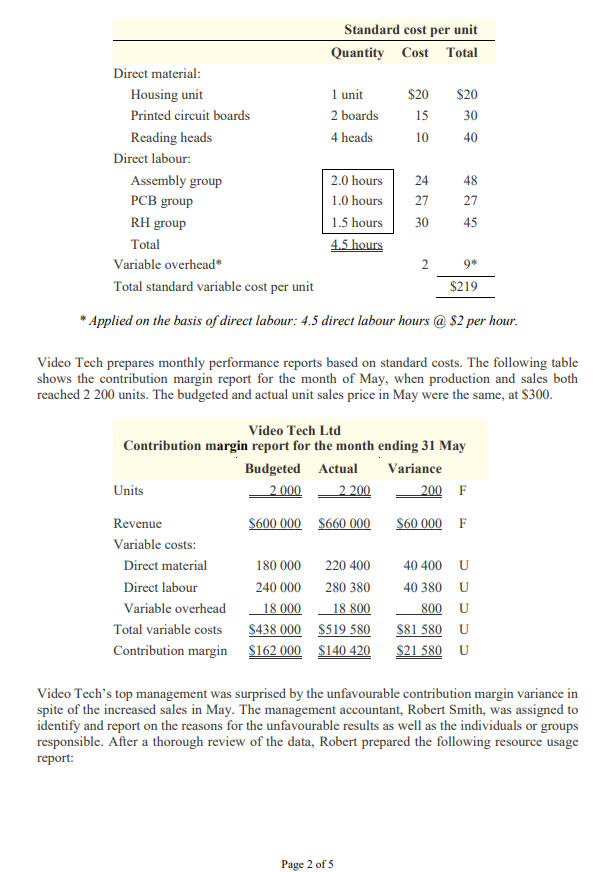
standard costs for video game machines are as follows:
DATA SHOWN IN IMAGE 1 ATTACHED...
Video Tech prepares monthly performance reports based on standard costs. The following table
shows the contribution margin report for the month of May, when production and sales both
reached 2 200 units. The budgeted and actual unit sales price in May were the same, at $300.
DATA SHOWN IN IMAGE 1 ATTACHED...
Video Tech’s top management was surprised by the unfavourable contribution margin variance in
spite of the increased sales in May. The
identify and report on the reasons for the unfavourable results as well as the individuals or groups
responsible. After a thorough review of the data, Robert prepared the following resource usage
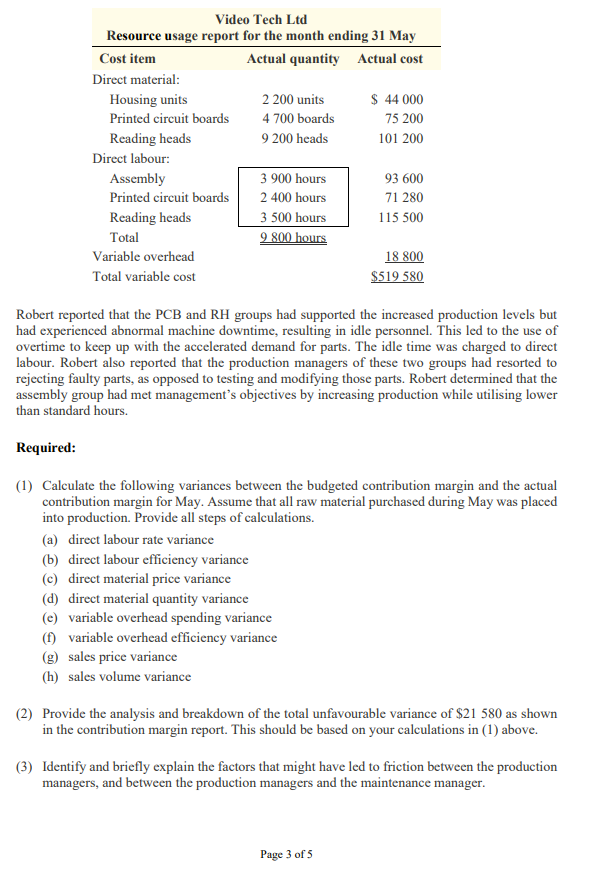
report:
DATA SHOWN IN IMAGE 2 ATTACHED...
Robert reported that the PCB and RH groups had supported the increased production levels but
had experienced abnormal machine downtime, resulting in idle personnel. This led to the use of
overtime to keep up with the accelerated demand for parts. The idle time was charged to direct
labour. Robert also reported that the production managers of these two groups had resorted to
rejecting faulty parts, as opposed to testing and modifying those parts. Robert determined that the
assembly group had met management’s objectives by increasing production while utilising lower
than standard hours.
Required:
(1) Calculate the following variances between the budgeted contribution margin and the actual
contribution margin for May. Assume that all raw material purchased during May was placed
into production. Provide all steps of calculations.
(a) direct labour rate variance
(b) direct labour efficiency variance
(c) direct material price variance
(d) direct material quantity variance
(e) variable overhead spending variance
(f) variable overhead efficiency variance
(g) sales price variance
(h) sales volume variance
(5) Prepare a revised contribution margin report showing proper variable cost variances based on
a flexible budget instead of the static budget used by Robert Smith. Use the following format:
Static Flexible Actual Variance
Budget Budget
Units
Revenue
Variable costs:
Direct material
Housing units
Printed circuit boards
Reading Heads
Total direct material
Direct labour
Assembly
Printed circuit boards
Reading Heads
Total direct labour
Variable overhead
Total variable costs
Contribution margin
CAN YOU PLEASE SOLVE QUESTION 1. E AND F
ALSO QUESTION 5 PLEASE !!!


Trending now
This is a popular solution!

Step by step
Solved in 3 steps

Hi Tutor, Can you please write some comment for revised contribution margin I mean how it came and also its impacts on this case and role of it in this case.
IT would be highly appreciated


