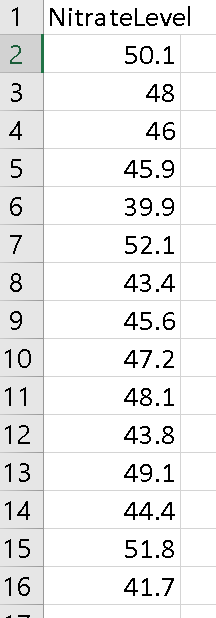
1 NitrateLevel 2 50.1 3 48 4 46 5 45.9 6. 39.9 7 52.1

MATLAB: An Introduction with Applications
6th Edition
ISBN:9781119256830
Author:Amos Gilat
Publisher:Amos Gilat
Chapter1: Starting With Matlab
Section: Chapter Questions
Problem 1P
icon
Related questions
icon
Concept explainers
Topic Video
Question
1 Nitratelevel
2
50.1
3
48
4
46
45.9
6.
39.9
7
52.1
8
43.4
45.6
10
47.2
11
48.1
12
43.8
13
49.1
14
44.4
15
51.8
16
41.7
Transcribed Image Text:1 Nitratelevel 2 50.1 3 48 4 46 45.9 6. 39.9 7 52.1 8 43.4 45.6 10 47.2 11 48.1 12 43.8 13 49.1 14 44.4 15 51.8 16 41.7
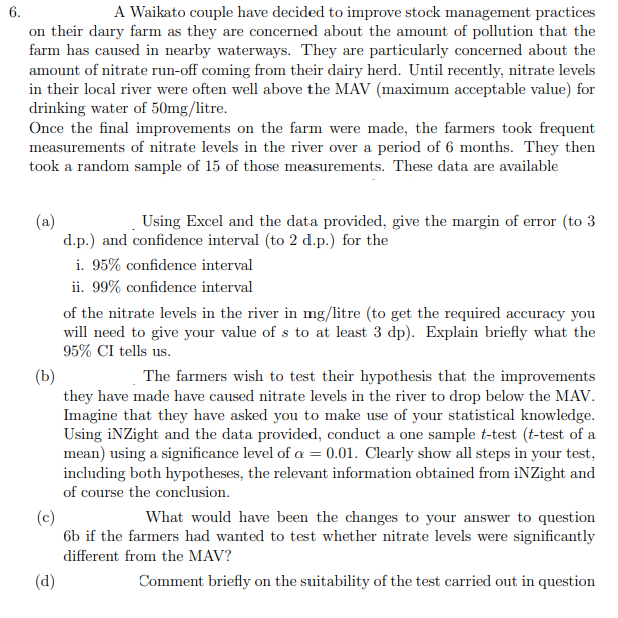
6.
A Waikato couple have decided to improve stock management practices
on their dairy farm as they are concerned about the amount of pollution that the
farm has caused in nearby waterways. They are particularly concerned about the
amount of nitrate run-off coming from their dairy herd. Until recently, nitrate levels
in their local river were often well above the MAV (maximum acceptable value) for
drinking water of 50mg/litre.
Once the final improvements on the farm were made, the farmers took frequent
measurements of nitrate levels in the river over a period of 6 months. They then
took a random sample of 15 of those measurements. These data are available
(a)
d.p.) and confidence interval (to 2 d.p.) for the
i. 95% confidence interval
ii. 99% confidence interval
Using Excel and the data provided, give the margin of error (to 3
of the nitrate levels in the river in mg/litre (to get the required accuracy you
will need to give your value of s to at least 3 dp). Explain briefly what the
95% CI tells us.
(b)
they have made have caused nitrate levels in the river to drop below the MAV.
Imagine that they have asked you to make use of your statistical knowledge.
Using iNZight and the data provided, conduct a one sample t-test (t-test of a
mean) using a significance level of a = 0.01. Clearly show all steps in your test,
including both hypotheses, the relevant information obtained from iNZight and
The farmers wish to test their hypothesis that the improvements
of course the conclusion.
What would have been the changes to your answer to question
(c)
6b if the farmers had wanted to test whether nitrate levels were significantly
different from the MAV?
(d)
Comment briefly on the suitability of the test carried out in question
Transcribed Image Text:6. A Waikato couple have decided to improve stock management practices on their dairy farm as they are concerned about the amount of pollution that the farm has caused in nearby waterways. They are particularly concerned about the amount of nitrate run-off coming from their dairy herd. Until recently, nitrate levels in their local river were often well above the MAV (maximum acceptable value) for drinking water of 50mg/litre. Once the final improvements on the farm were made, the farmers took frequent measurements of nitrate levels in the river over a period of 6 months. They then took a random sample of 15 of those measurements. These data are available (a) d.p.) and confidence interval (to 2 d.p.) for the i. 95% confidence interval ii. 99% confidence interval Using Excel and the data provided, give the margin of error (to 3 of the nitrate levels in the river in mg/litre (to get the required accuracy you will need to give your value of s to at least 3 dp). Explain briefly what the 95% CI tells us. (b) they have made have caused nitrate levels in the river to drop below the MAV. Imagine that they have asked you to make use of your statistical knowledge. Using iNZight and the data provided, conduct a one sample t-test (t-test of a mean) using a significance level of a = 0.01. Clearly show all steps in your test, including both hypotheses, the relevant information obtained from iNZight and The farmers wish to test their hypothesis that the improvements of course the conclusion. What would have been the changes to your answer to question (c) 6b if the farmers had wanted to test whether nitrate levels were significantly different from the MAV? (d) Comment briefly on the suitability of the test carried out in question
Expert Solution
steps

Step by step

Solved in 2 steps with 1 images

Blurred answer
Knowledge Booster
Centre, Spread, and Shape of a Distribution
Learn more about
Need a deep-dive on the concept behind this application? Look no further. Learn more about this topic, statistics and related others by exploring similar questions and additional content below.
Similar questions
  • SEE MORE QUESTIONS
Recommended textbooks for you
MATLAB: An Introduction with Applications
Statistics
ISBN:
9781119256830
Author:
Amos Gilat
Publisher:
John Wiley & Sons Inc
Probability and Statistics for Engineering and th…
Statistics
ISBN:
9781305251809
Author:
Jay L. Devore
Publisher:
Cengage Learning
Statistics for The Behavioral Sciences (MindTap C…
Statistics
ISBN:
9781305504912
Author:
Frederick J Gravetter, Larry B. Wallnau
Publisher:
Cengage Learning
Elementary Statistics: Picturing the World (7th E…
Statistics
ISBN:
9780134683416
Author:
Ron Larson, Betsy Farber
Publisher:
PEARSON
The Basic Practice of Statistics
Statistics
ISBN:
9781319042578
Author:
David S. Moore, William I. Notz, Michael A. Fligner
Publisher:
W. H. Freeman
Introduction to the Practice of Statistics
Statistics
ISBN:
9781319013387
Author:
David S. Moore, George P. McCabe, Bruce A. Craig
Publisher:
W. H. Freeman