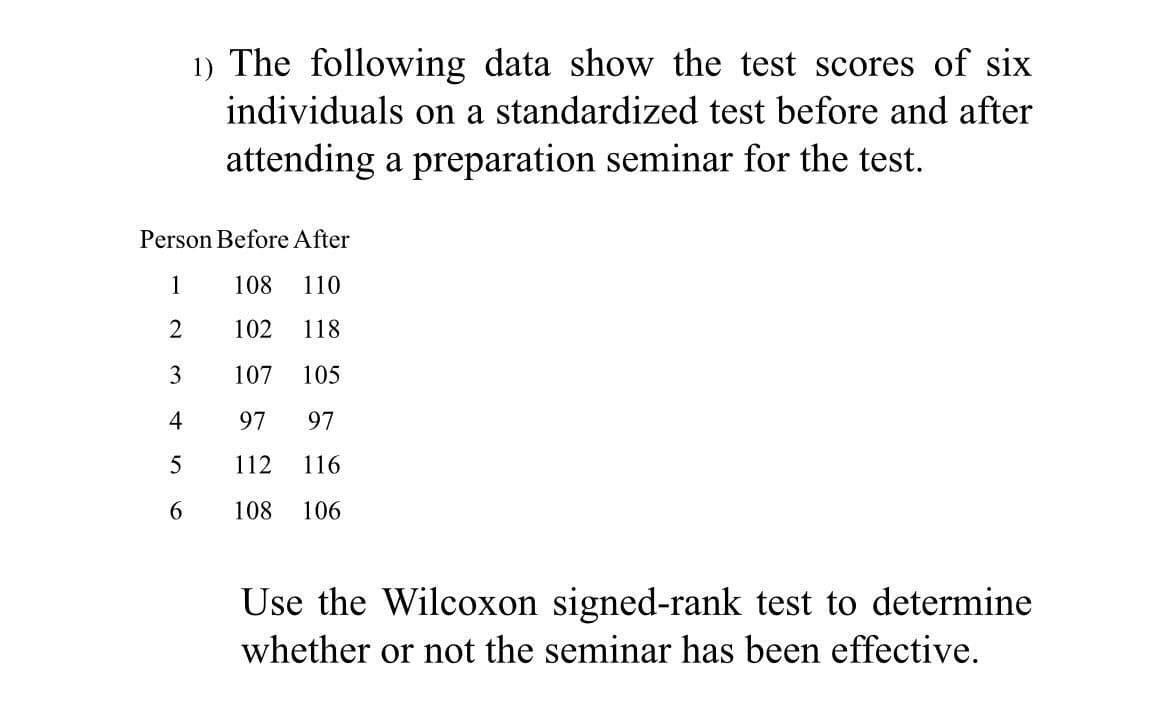
1) The following data show the test scores of six individuals on a standardized test before and after attending a preparation seminar for the test. Person Before After 1 108 110 2 102 118 107 105 4 97 97 5 112 116 6. 108 106 Use the Wilcoxon signed-rank test to determine whether or not the seminar has been effective.


Q: consider in the 1. The following are determination on sample size EXCEPT for the A. Margin of error…
A: For the given statements select the correct choice
Q: Solve the following problem according to the proper test to be used: The table shows the hours of…
A:
Q: Say you roll two dice. Find the probability c rolling a number greater than 2 on the first, and then…
A:
Q: Calculate the Pearson product-moment correlation coefficient (r) to 2 decimal places for the data…
A: Hello! As you have posted more than 3 sub parts, we are answering the first 3 sub-parts. In case…
Q: Ten subjects were chosen for an experiment. They were asked to perform a certain physical activity.…
A: Solution: Before After d=After -Before (d-d ) (d-d )2 60 92 32 23.2 538.24 67 79 12 3.2…
Q: Question A political candidate has asked you to conduct a poll to determine what percentage of…
A: Given that Margin of error n=0.07 99% confidence interval.
Q: What is the relationship between the population mean and the mean of the distribution of sample…
A: Mean is the avg. of the given numbers.
Q: 4. Ms Julia Palaç is an instructor in Statistics. She gave an examination before and after he…
A:
Q: For numbers 5-11, refer to the following given values: 99% confidence level,o=7 and E = 2. %3D 5.…
A: Since you posted a question with multiple subparts, we will solve first three subparts for you. To…
Q: Decide whether the data are at the interval level or at the ratio level. 1. The body temperatures…
A: The body temperatures of an athlete during an exercise session is a ratio scale of measurement as it…
Q: In a survey of 1000 drivers from Region A, 848 wear a seat belt. In a survey of 1000 drivers from…
A: Here use 2 sample proportion of z test
Q: I want to assess whether or not students produce more stress hormones (cortisol) after watching…
A: Given claim: The hypothesis that saliva cortisol levels will be different between the two genres of…
Q: 12. If Jerry randomly chooses a single sock, what is the probability that it is black? C. 50% D. 14%…
A: We have given that about Jerry’s socks drawer, which has 6 white socks and 14 black socks. Total…
Q: You have just received your score in a mathematics aptitude test. Given your score was 82 and the…
A:
Q: 12.What is the sample size needed if the margin of error is 30 and the standard deviation of 45 with…
A: (12) We have given that, Confidence level (C.I) = 98% , standard deviation (σ) = 45 and margin of…
Q: Find the power of the test for each combination of effect size and total sample size below…
A: Please find the solution below. Thank you
Q: Find the value of p from the table above. Calculate the probability that at X is at least 5.…
A: here Given table for discrete random variable X
Q: The GPAs of all 5540 students enrolled at a university have an approximately normal distribution…
A: The sampling distribution is the representation of all possible samples drawn from the large…
Q: Locate the following percentile under the normal curve and find its corresponding t-value. Sketch…
A: The t-distribution is a type of continuous probability distribution that takes random values on the…
Q: What is the probability of getting the first "three" in the 6' roll?
A: here given, balanced 6 sided die rolled , here use geometric distribution
Q: A population of a certain LGBTQ+ community consists of six measurements: 2, 3, 6, 9, 11 and 5. What…
A: Given that The data are 2,3,6,9,11,5 Find sample mean
Q: d. One of the assumptions that needs to hold for the process {yt} to be weakly stationary is that…
A: Given three statements about time series model.
Q: 2*
A: HERE use standard normal distribution
Q: Splice the following two series of index numbers together so as to give a ontinuous series with (i)…
A:
Q: Write the Null Hypothesis or the Alternative Hypothesis of the following:
A: Given: H0:μ=10.2
Q: Fill in the blank with the correct word or phrase to complete each sentence. 1. The Student's…
A: “Since you have posted a question with multiple sub-parts, we will solve first three subparts for…
Q: A random sample of 25 of the 400 members of the Bigtime Theater Company is surveyed about how many…
A: Given: 3 5 5 3 4 4 1 3 6 10 1 3 4 5 1 2 4 2 3 2 5 5…
Q: Solve
A: We need to determine Χα2 such that P[Χ2<Χα2 ] = 0.95 when v =6
Q: The players of Maluleke FC are from two main towns of Limpopo province, Tzaneen and Polokwane. From…
A: Given,no.of players from Tzaneen=20no.of players from Polokwane=8Total no.of players=28
Q: Apply the knowledge you obtained from the discussion by solving the given problems below. 1. A 99%…
A: Given that Population Standard deviation=?=20 99% confidence interval Formula for Sample Size…
Q: The index of 1992 is 100. It rises by 5% in 1993, falls 2% in 1994, rises 40% in 1995, rises 10% in…
A:
Q: For the following population, calculate Kurtosis coefficient, Frequency histogram, Normal…
A: Given: 156 161 172 162 167 158 163 160 155 160 165 173 152 168 160…
Q: 1. The table below give the output for 6 years of an experimental farm that used each of 4…
A: Anova is used to measure the mean significant relationship among three or more treatments. Anova is…
Q: i. What is the probability that the second unreliable computer will be found on the fifth computer?…
A: It was found that eight percent of the computers produced by Mala Investment are unreliable. If the…
Q: From the following data find out (i) purchasing power of money, (ii) real income, and (iii) real…
A:
Q: A researcher wishes to try three different techniques to lower the blood pressure of individuals…
A: For the given data Perform Anova: Single Factor
Q: Number 2 a and b
A:
Q: Example 59. A company may obtain a particular machine either by leasing it for 5 years at an annual…
A:
Q: The number of visitors to a tourist attraction was recorded for a period of 7 sample weeks, 4210…
A: Note: As per company guidelines only three sub-parts at time can be answered. Kindly, resubmit the…
Q: I want to study whether or not distractions in the environment will affect memory performance. I…
A: There are two independent samples which are distraction free environment and environment with…
Q: Assume that a sample is used to estimate a population proportion p. Find the 99.9% confidence…
A:
Q: 6. Awater taxi carries passengers from harbor to another. Assume that weights of passengers are…
A: Given that mu =196 ,s.d =42
Q: Consider a regression study involving a dependent variable y, a quanttative independent variabe nd s…
A:
Q: AV I L uL ITL u HALAS JU LULMLIN\ For a random sample of 60 overweight men, the mean of the number…
A:
Q: Suppose Z follows the standard normal distribution. Calculate the following probabilities using the…
A: We have to find given probability....
Q: An average of 3 cars arrived at a highway tollgate every minute. What is the probability that at…
A: GivenAn average of 3 cars arrived at tollgate every minutefor 15minutes = 3*15=45λ=45 cars for…
Q: The following data represents the ages of 40 employees in the Ministry of Electricity, which is…
A: For the given data Supply the frequency distribution table
Q: From the following particulars chalk out an industrial activity index number for the year 1998…
A: For the given , particularl chalk out an industrial activity, we need to calculate the index number…
Q: A researcher is interested to see if income is related to education level. Income (Dollars)…
A: Given: Income (Dollars) Education (Years) 36577 11 54365 12 33542 10 65654 12 45765 11…
Q: Use the boxplot (photo) for the current golf balls to say whether the data are symmetrical or…
A: We want to tell the box-plot is skewed or symmetrical

Step by step
Solved in 2 steps with 1 images

- The following table contains the results of a survey of daily rental rates of a mid-size car for three major rental car companies at three airport locations on three different days during the year. Is there sufficient evidence to conclude that there is a significant difference among the average daily rental rates for mid-size cars for the three rental car companies? Daily Rental Rates of Mid-Size Cars ($) New York Chicago Miami Hertz 83.9983.99 81.9981.99 73.9973.99 89.9989.99 91.9991.99 45.9945.99 77.9977.99 89.9989.99 72.9972.99 Avis 75.8675.86 77.9977.99 70.9970.99 45.1045.10 86.9986.99 60.9960.99 48.9848.98 97.9997.99 90.9990.99 National 80.0080.00 75.9975.99 57.0057.00 56.0056.00 71.0071.00 53.9953.99 56.0056.00 77.9977.99 67.9967.99 Copy Data ANOVA Source of Variation SSSS dfdf MSMS Company 709.6404709.6404 22 354.8202354.8202 Location 1631.71781631.7178 22 815.8589815.8589 Interaction 1157.83361157.8336 44 289.4584289.4584 Within…From the following data, test whether there is any association betweenintelligence and economic conditions of 1000 students.EconomicConditionIntelligenceExcellent Good Medium Dull TotalGood 48 200 150 80 478Not good 52 180 190 100 522Total 100 380 340 180 1000The following table contains the results of a survey of daily rental rates of a mid-size car for three major rental car companies at three airport locations on three different days during the year. Is there sufficient evidence to conclude that there is a significant difference among the average daily rental rates for mid-size cars for the three rental car companies? Daily Rental Rates of Mid-Size Cars ($) New York Chicago Miami Hertz 70.9970.99 49.9949.99 47.9947.99 51.9951.99 49.9949.99 50.9950.99 47.9947.99 93.9993.99 70.9970.99 Avis 87.8687.86 47.9947.99 88.9988.99 87.1087.10 71.9971.99 80.9980.99 76.9876.98 99.9999.99 74.9974.99 National 70.0070.00 71.9971.99 58.0058.00 73.0073.00 60.0060.00 61.9961.99 66.0066.00 71.9971.99 50.9950.99 Copy Data ANOVA Source of Variation SSSS dfdf MSMS Company 1969.87811969.8781 22 984.9391984.9391 Location 123.5111123.5111 22 61.755661.7556 Interaction 472.1981472.1981 44 118.0495118.0495 Within…
- The following table shows the result of an IQ test for two groups of student. Gorup A 1 2 3 4 5 6 7 8 9 10 11 12 13 IQ 105 108 103 106 106 114 107 104 114 110 111 112 112 B 1 2 3 4 5 6 7 8 9 10 11 12 13 IQ 118 118 109 120 109 112 127 106 110 116 115 106 116 Use T-test to examine if there is a significant difference between the average IQs of the twogroups at a:a- 0.05 level of significanceb- 0.001 level of significancePlease show your calculations and explain the meaning of resultsConsider the following actual data from a study by Lyon and Greenberg (1991). The first factor in their factorial ANOVA was family background; female participants were classified into two groups (Group 1: codependent, women with an alcoholic parent; Group 2: non-codependent, women with nonalcoholic parents). Members of these two groups were randomly assigned to one of two conditions; they were asked to donate time to help a man who was described to them as either Mr. Wrong (exploitative, selfish, and dishonest) or Mr. Right (nurturant, helpful). The researchers predicted that women from a non-codependent/nonalcoholic family background would be more helpful to a person described as nurturant and helpful, whereas women from a codependent/alcoholic family background would be more helpful to a person described as needy, exploitative, and selfish. The table of means below represents the amount of time donated in minutes in each of the four cells of this 2 × 2 factorial design. In each cell,…The following table shows data collected from a random sample of 2,500 people who recently went on a vacation, who indicated their favorite part of their vacation. Shows Dining Activities Shopping Total Children 30 0 170 0 200 Teens 150 75 250 25 500 Adults 250 250 250 250 1,000 Seniors 300 150 50 300 800 Total 730 475 720 575 2,500 Based on the table, what proportion of the people selected gave a response other than shopping as the favorite part of their vacation? 5752,5005752,500 5752,500 A 7202,5007202,500 7202,500 B 1,9252,5001,9252,500 1,9252,500 C 4752,5004752,500 4752,500 D 7302,5007302,500 7302,500 E
- In a study of the effectiveness of certain exercises inweight reduction, a group of 16 persons engaged in theseexercises for one month and showed the following results:Weight Weight Weight Weightbefore after before after211 198 172 166180 173 155 154171 172 185 181214 209 167 164182 179 203 201194 192 181 175160 161 245 233182 182 146 142 Use the 0.05 level of significance to test the null hypoth-esis μ1 − μ2 = 0 against the alternative hypothesis μ1 − μ2 > 0, and thus judge whether the exercises areeffective in weight reduction.The following data represent the number of hours that a rechargeable hedge trimmer operates before a recharge isrequired: 1.5, 2.2 0.9, 1.3, 2.0, 1.6, 1.8, 1.5, 2.0, 1.2, and 1.7. Use the sign test to test the hypothesis at the 0.05 level ofsignificance that this particular trimmer operates with a median of 1.8 hours before requiring a recharge.A marketing firm wants to know if there is a difference in the best marketing strategy for new customers compared to returning customers. In order to determine the relationship between marketing strategy and customer type, the following information on number of sales generated is obtained for each group. Is there sufficient evidence at the 0.010.01 level of significance to conclude that an association exists between marketing strategy and customer type? Observed Sample of Customers Paid search Social Media Web retargeting Total New customer 167167 154154 140140 461461 Returning customer 146146 145145 164164 455455 Total 313313 299299 304304 916916 Copy Data Step 1 of 4 : Calculate the expected value for the number of sales generated by the web retargeting strategy for new customers. Round your answer to six decimal places.
- The following data are taken from an experiment in which the subjects were tested for motion sickness. Thesubjects were randomly assigned to either the control group which was given a placebo or the experimentalgroup which was given the drug Astemizole and observed on an ocean voyage. The same subjects were thenswitched and those that had the placebo were now given the drug, and those that had the drug were nowgiven a placebo and observed on a new ocean voyage taking the same course. The results are the number ofhead movements that the subjects could endure without becoming nauseous. Use α = 0.05 to test the claimthat Astemizole is effective, i.e. it takes a larger number of head movements before the subject getsnauseous.Control 19 45 36 42 38 31 30 40 41 35Drug 20 55 36 45 40 32 41 38 44 29 1) State the hypotheses and identify the claim. Group 1 is the Control group. 2)Find the test statistic and Find the p-value. 3)Make the decision and Summarize the results.The following are the ratings of males by females in an experiment involving speed dating. Use the given data to construct a boxplot and identify the 5-number summary. 2.0 3.0 4.0 4.5 5.0 5.0 5.5 5.5 5.5 5.5 5.5 6.5 6.5 7.5 7.5 7.5 8.5 8.5 8.5 9.5 The 5-number summary is enter your response here, enter your response here, enter your response here, enter your response here, and enter your response here. (Use ascending order. Type integers or decimals. Do not round.)Big Rock Insurance Company did a study of per capita income and volume of insurance sales in eight Midwest cities. The volume of sales in each city was ranked, with 1 being the largest volume. The per capita income was rounded to the nearest thousand dollars. Reading 1 2 3 4 5 6 7 8 Rank of insurance sales volume 3 5 1 7 8 4 6 2 Per capita income in $1000 16 12 17 14 13 19 15 18 Using a 0.01 level of significance, test the claim that there is a monotone relation (either way) between rank of sales volume and rank of per capita income. (a) Using a rank of 1 for the highest per capita income, make a table of ranks to be used for a Spearman rank correlation test. City Rank ofinsurance salesvolume x Rank of percapita income in$1000 y d = x - y d2 12345678 Σd2 = (b) What is the level of significance? (c) Compute the sample test statistic. (Use 3 decimal places.)


