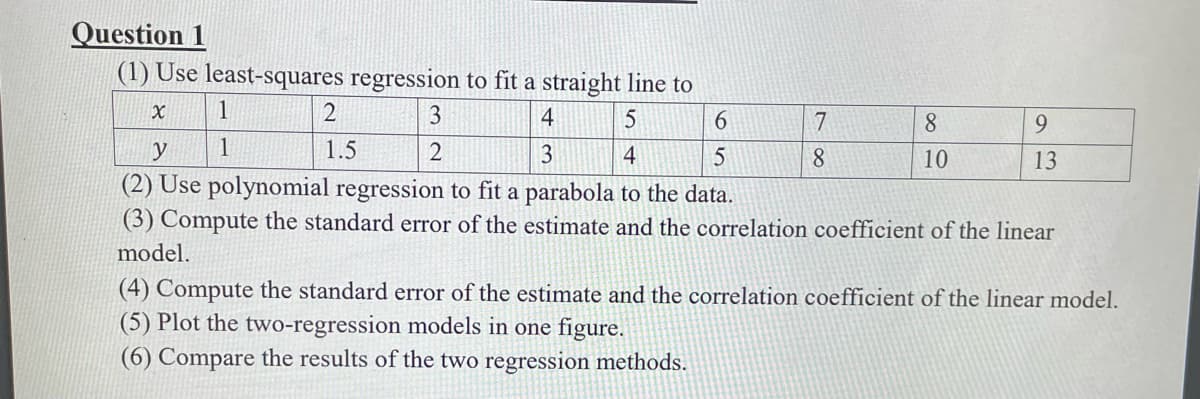
(1) Use least-squares regression to fit a straight line to X 4 5 3 4 y 1 1 2 1.5 3 2 6 5 7 8 8 10 9 13


Q: Rolling a fair n-sided die gives us a random number uniformly distributed among {1, 2,..., n} (our…
A: (a) Since the die is fair, each of the numbers 1,2,…,n has an equal probability of 1n of appearing…
Q: The Five-Number Summary of Positions Summarize positions that help to describe center and…
A: Given data: For urban area: 8.3, 0.9, 2.9, 5.6, 5.8, 5.4, 1.2, 1.0, 1.4, 2.1, 1.3, 5.3, 8.8, 6.6,…
Q: -2x 5. Suppose that one observation from the following exponential distribution ƒ(x) = λe¯¹, x>0, is…
A:
Q: 5. Random variables X and Y have the joint PDF shown below: -1.0 y 2.0 1.0 -1.0 -2.0 1.0 fxy(x, y) =…
A:
Q: What is the probability of a fair coin landing heads up at least twice in five tosses, and how does…
A:
Q: Were all seven steps of the scientific method referenced in the Drug X report summary in this…
A: Given data : Were all seven steps of the scientific method referenced in the Drug X report summary…
Q: A survey found that women's heights are normally distributed with mean 63.6 in and standard…
A: Answer Given Mean =63.6 standard deviation =2.5 We know that Z-score: Z =[x-mu]/[σ] z*σ =[x-mu]…
Q: Consider the 2-period ahead forecast is not true? O a. If the ARMA(p, q) is invertible, then y y O…
A: Explanation: (a) is not true because even if the ARMA(p, q) is invertible, the forecast y^T+2 is not…
Q: Given the difference equation y(k + 2) − 2 y(k + 1) + = y(k) = = e(k) where y(0) = y(1) = 0, e(0) =…
A:
Q: Regardless of your previous answers, let's say you make a 99% confidence interval and the interval…
A: Given information- We have given a 99% confidence interval- Lower limit = 0.14 Upper limit = 0.26…
Q: Approximately 10% of all people are left-handed. Consider 12 randomly selected people. Find the…
A: Givenprobability of all people are left-handed(p)=0.10sample size(n)=12Let "x" be the no.of people…
Q: consider the box plot below. What percent of the scores are between 3 and 10?
A: A box plot is given.
Q: A final exam in Math 160 has a mean of 73 with standard deviation 7.8. If 24 students are randomly…
A: given data, normal distributionμ=73σ=7.8n=24we have to find out the given proabbility .
Q: A local fast food restaurant interviews every 10th customer placing an order at the counter. What…
A: According to the question, a local fast food restraunt interviews every 10th customer placing an…
Q: A tutoring company claims that 75% of the high school students who hire one of their tutors will…
A: Given that, The tutoring company claims that 75% of the high school students who hire one of their…
Q: A random variable is normally distributed. It has a mean of 241 and a standard deviation of 17. For…
A: given data, normal distributionμ=242σ=17we have to find out the given probabilties.
Q: be
A: Given, mean (μ)=2250 μ standard deviation (σ)=579.5 Let 'X' be the per capita energy…
Q: If a population has a mean of 7, what is the mean of the sampling distribution of its mean?
A: We have given that Population mean=μ=7
Q: The area of the shaded region is (Round to four decimal places as needed.)
A: Given that, Bone density scores with a mean of 0 and sd are 1. To find the area of the shaded…
Q: Show your work in the box below. A set of data is normally distributed with a mean of 40 and…
A: We have given that Mean(µ) = 40Standard deviations (σ) = 5X ~ N (µ, σ )= N(40, 5)
Q: a) The University of the East Europe is interested in the overall performance of its students in the…
A: Given data : The University of the East Europe is interested in the overall performance of its…
Q: (Depreciation). Table 2 gives the market value of a luxury sedan (in dollars) x years after its…
A: Given information: Given data represents the values of the independent variable x and the dependent…
Q: If two events A and B have the same (non-zero) probability... Group of answer choices the two…
A: If two events A and B have the same (non-zero) probability, none of these statements are necessarily…
Q: = Let y1, . . . , yn real numbers, and let y n Σ₁ yi be their arithmetic mean. Show that for any…
A: Given that y-=∑yi/n We have to show that ∑(yi-a)2=∑(yi-y-)2+n(y--a)2
Q: 1. Make a statistical decision about the null. Will you reject or fail to reject the null based on…
A: Given that sample size (n) = 10, sample mean, M = 6.7 and sample SD, s = 1.22
Q: For a 95% confidence interval, what value will you use for t*? Group of answer choices 1.960 2.030…
A: There are two types of houses, houses with a view of a nearby lake and houses with no view of the…
Q: A researcher is testing the effect of a new cold and flu medication on reaction time. A sample of…
A: It is given that: M=231.37s=28.18n=16 The objective is to validate if the average reaction time…
Q: Safeway Foods is redesigning the checkout lanes in their supermarkets throughout the Midwest, and…
A: Suppose μ1, μ2 are the population means of checkout times of Design 1 and Design 2, respectively.
Q: Strassel Investors buys real estate, develops it, and resells it for a profit. A new property is…
A: a) To estimate the probability of Strassel obtaining the property using a bid of $129,000, we can…
Q: There are 6 numbered balls in a bag. Each ball has a distinct number and the numbers are in {1,2, 3,…
A: Here given that there are 6 numbered balls in a bag. Each ball has a distinct number and the numbers…
Q: Consider the experiment of tossing a coin 2 times, with equal chance of obtaining H (head) and T…
A: The experiment is of tossing a coin twice. Let head denote 1 and tail denote 0. Let X = the no. of…
Q: Heteroskedasticity arises because of non-constant variance of the error terms. We said proportional…
A: The linear regression model is valid when it satisfies few assumptions like Linearity, Normality,…
Q: ou want to obtain a sample to estimate a population proportion. At this point in time, you have no…
A: given data , no reasonable estimate for the population proportion. assume that…
Q: We are given the data for analysis. It includes the attribute age. The age values for the data…
A: Given data: 13,45,22,25,46,21,15,16,25,52,16,35,70,35,25,36,19,20,22,25,30,33,33,20,35,35,40.
Q: A private college in Ohio wishes to determine whether or not students living on campus have similar…
A: Given Information: Resident students: Sample size n1=120 Sample mean x¯1=2.82 Sample standard…
Q: Human heights are one of many biological random variables that can be modeled by the normal…
A: Given that Mean=M=176.7 Standard deviation=S=9.9
Q: What is true about populations? Group of answer choices The population is everyone who is relevant…
A: Given that The correct statement about populations is: The population is everyone who is relevant to…
Q: Application of z-test/t-test 1. The college students in a university go through an average of 500…
A: The question is about hypo. testing Given : Popl. mean no. of disposable cups in a year ( μ ) = 500…
Q: Problem 2. Consider the linear regression set-up Y = XB+ e where €~ Nn (0,02 In); the design matrix…
A: ANSWER: (i) LS estimates Bo and B1 are chosen to minimize the sum of squared residuals e = Y -…
Q: if a customer buys 3 or more items they will receive a discount on shipping costs. what is the…
A: Let X be the random variable for the no. of items purchased per visit. The prob. dist. of X is, x…
Q: A genetic experiment with peas resulted in one sample of offspring that consisted of 447 green peas…
A: a. Suppose p is the population proportion of yellow peas.
Q: A quality control technician is checking the weights (in grams) of a Nescafe Gold Blend Coffee. She…
A: Answer Given 50.3,49.6,51.3,49.8,51.3,49.9,51.1 n=7 sample size denoted as [n]. confidence…
Q: A normal distribution has ? = 28 and ? = 5. (a) Find the z score corresponding to x = 23. (b) Find…
A: given data normal distributionμ = 28σ = 5
Q: c. All else being equal, find a 95% confidence interval for the percentage increase in…
A: Given data : Sample n = 2226 R2 = 0.187 SF = 0.0527 i = 1.1532 Confidence interval = 95% No of…
Q: The mean height of Americans in 1776 was 67 inches with a standard deviation of 3 inches. George…
A: Given,mean(μ)=67 inchesStandard deviation(σ)=3 inches Empirical rules:1) P(μ-σ<X<μ+σ)=68%2)…
Q: QUESTION 27 What happens to the width of a confidence interval as the sample size decreases? The…
A: Givensample size of the confidence interval decreases
Q: Calculate the measures of central tendency for the grouped data and the measures of dispersion for…
A: It is given that- Total observations =40 Minimum value =13 Maximum value =48 class interval=6
Q: A survey of 15 adults in UAE found that the mean age for a person's primary vehicle is 3.4 years and…
A:
Q: The central union of Las Palomas, in Santiago has been involved in a dispute with the Mamoncito…
A: This question examines the dispute between the central union of Las Palomas in Santiago and the…
Q: Claim: Carzz Magazine claims that the Civic Hybrid gets exactly 38 mpg on the highway. A random…
A: Given Information: The random sample of size, n=56 The sample mean, x=39.43 mpg The population…

Step by step
Solved in 5 steps

- Suppose the simple linear regression model, Yi = β0 + β1 xi + Ei, is used to explain the relationship between x and y. A random sample of n = 12 values for the explanatory variable (x) was selected and the corresponding values of the response variable (y) were observed. A summary of the statistics is presented in the photo attached. Let b1 denote the least squares estimator of the slope coefficient, β1. What is the value of b1?For the regression model Yi = b0 + eI, derive the least squares estimator.The least-squares regression equation is y=620.6x+16,624 where y is the median income and x is the percentage of 25 years and older with at least a bachelor's degree in the region. The scatter diagram indicates a linear relation between the two variables with a correlation coefficient of 0.7004. Predict the median income of a region in which 30% of adults 25 years and older have at least a bachelor's degree.
- Question 1 Provide an algebraic proof that the least squares estimator is not consistent when Cov(x,e)=0 with the regression model y =B1+B2E(x)+e where E(e)=0 So that E(y) = B1 + B2E(x) Full explain this morning and text typing work only thanksThe least-squares regression equation is y=620.6x+16,624 where y is the median income and x is the percentage of 25 years and older with at least a bachelor's degree in the region. The scatter diagram indicates a linear relation between the two variables with a correlation coefficient of 0.7004. In a particular region, 28.3 percent of adults 25 years and older have at least a bachelor's degree. The median income in this region is $37,389. Is this income higher than what you would expect? Why?A1 We want to estimate the following simple linear regression model with heteroskedas- ticity by Generalized Least Squares (GLS): yi =β0 +β1xi +ui i=1,...,n where V ar(ui|xi) = (3 + 5x2i )σ2 and σ2 is a population parameter. Explain how the GLS estimators are obtained for this specific model. Describe the underlying intuition of the GLS estimation procedure. Provide mathematical formulas
- The least-squares regression equation is y=647.8x+17,858 where y is the median income and x is the percentage of 25 years and older with at least a bachelor's degree in the region. The scatter diagram indicates a linear relation between the two variables with a correlation coefficient of 0.7507. predict the median income of a region in which 20% of adults 25 years and older have at least a bachelor's degree. Round to the nearest dollar as needed.The least-squares regression equation is y=728.0x+14,705 where y is the median income and x is the percentage of 25 years and older with at least a bachelor's degree in the region. The scatter diagram indicates a linear relation between the two variables with a correlation coefficient of 0.8165. For every dollar increase in median income, the percent of adults having at least a bachelor's degree is ___%, on average. For a median income of $0, the percent of adults with a bachelor's degree is ____%.The first step of the Durbin-Watson test for the presence of autocorrelation is to estimate the model and determine Select one: a. the residuals lagged one period. b. the current period residuals and the residuals lagged one period. c. the current period residuals. d. the current period residuals, the residuals lagged one period, and the residuals lagged two periods.
- Assuming that this simple linear regression model fulfills all the classical assumptions we discussed in class, please show that the OLS estimator for the intercept of the simple linear regression model is an unbiased estimator.A regression was run to determine if there is a relationship between the happiness index (y) and life expectancy in years of a given country (x).The results of the regression were: ˆyy^=a+bxa=-1.778b=0.143 (a) Write the equation of the Least Squares Regression line of the formˆyy^= + x(b) Which is a possible value for the correlation coefficient, rr? -0.853 0.853 -1.931 1.931 (c) If a country increases its life expectancy, the happiness index will decrease increaseKolmorogov-smirnov test T-test Mann-whitney Linear Regression Are these statistical analyses could be computed in SPSS automatically?

