1) Which sample will have the larger mean number of books read? 2) Which sample will have the larger standard deviation of the number of books read?
1) Which sample will have the larger mean number of books read? 2) Which sample will have the larger standard deviation of the number of books read?

MATLAB: An Introduction with Applications
6th Edition
ISBN:9781119256830
Author:Amos Gilat
Publisher:Amos Gilat
Chapter1: Starting With Matlab
Section: Chapter Questions
Problem 1P

Related questions
Question
Please read the following prompt, analyze the following graph, and complete question 2
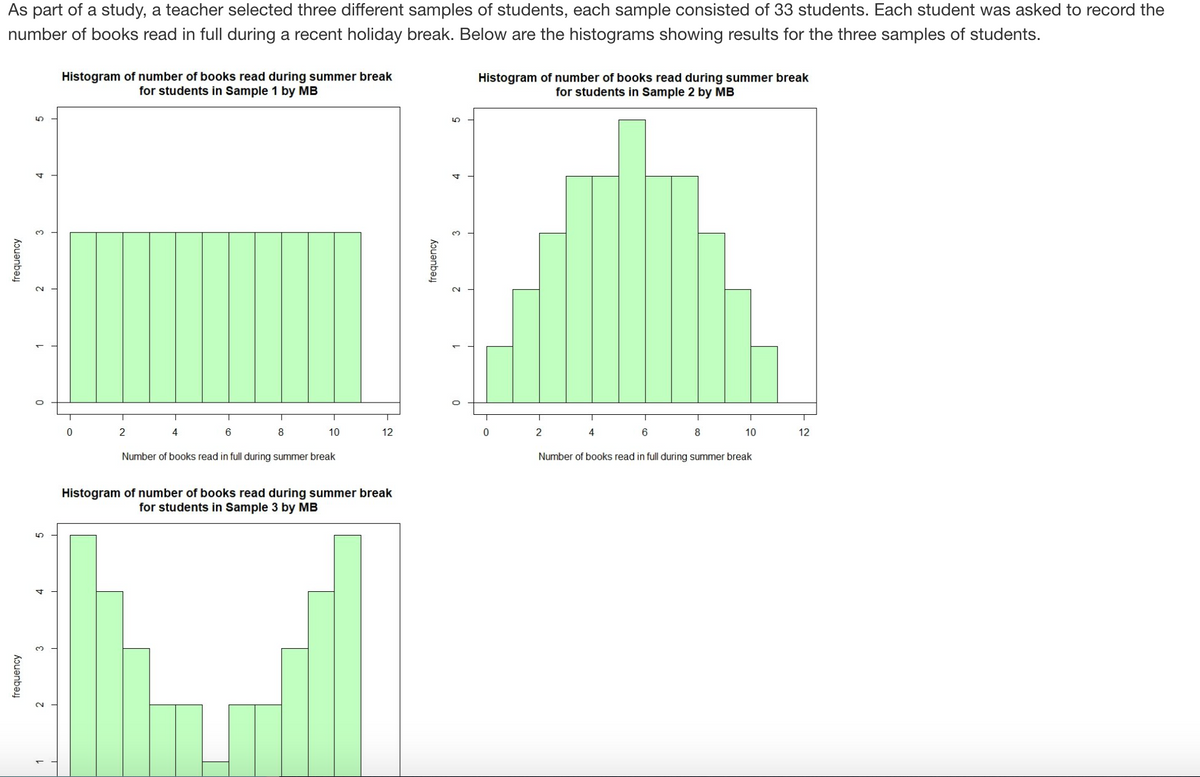
Transcribed Image Text:As part of a study, a teacher selected three different samples of students, each sample consisted of 33 students. Each student was asked to record the
number of books read in full during a recent holiday break. Below are the histograms showing results for the three samples of students.
Histogram of number of books read during summer break
for students in Sample 1 by MB
Histogram of number of books read during summer break
for students in Sample 2 by MB
2
4
8
10
12
2
8
10
12
Number of books read in full during summer break
Number of books read in full during summer break
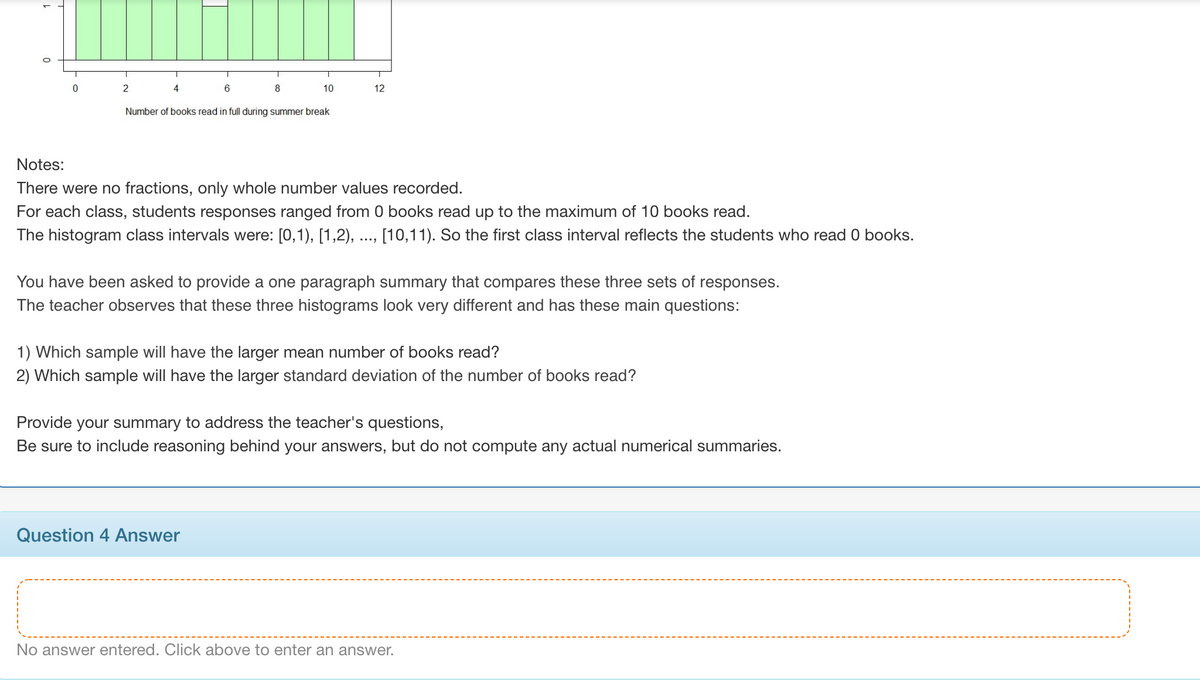
Histogram of number of books read during summer break
for students in Sample 3 by MB
frequency
frequency
frequency
Transcribed Image Text:4
8
10
12
Number of books read in full during summer break
Notes:
There were no fractions, only whole number values recorded.
For each class, students responses ranged from 0 books read up to the maximum of 10 books read.
The histogram class intervals were: [0,1), [1,2), ..., [10,11). So the first class interval reflects the students who read 0 books.
You have been asked to provide a one paragraph summary that compares these three sets of responses.
The teacher observes that these three histograms look very different and has these main questions:
1) Which sample will have the larger mean number of books read?
2) Which sample will have the larger standard deviation of the number of books read?
Provide your summary to address the teacher's questions,
Be sure to include reasoning behind your answers,
but do not compute any actual numerical summaries.
Question 4 Answer
No answer entered. Click above to enter an answer.
Expert Solution
This question has been solved!
Explore an expertly crafted, step-by-step solution for a thorough understanding of key concepts.

This is a popular solution!

Trending now
This is a popular solution!

Step by step
Solved in 5 steps with 3 images

Knowledge Booster


Learn more about
Need a deep-dive on the concept behind this application? Look no further. Learn more about this topic, statistics and related others by exploring similar questions and additional content below.Recommended textbooks for you
MATLAB: An Introduction with Applications
Statistics
ISBN:
9781119256830
Author:
Amos Gilat
Publisher:
John Wiley & Sons Inc

Probability and Statistics for Engineering and th…
Statistics
ISBN:
9781305251809
Author:
Jay L. Devore
Publisher:
Cengage Learning

Statistics for The Behavioral Sciences (MindTap C…
Statistics
ISBN:
9781305504912
Author:
Frederick J Gravetter, Larry B. Wallnau
Publisher:
Cengage Learning
MATLAB: An Introduction with Applications
Statistics
ISBN:
9781119256830
Author:
Amos Gilat
Publisher:
John Wiley & Sons Inc
Probability and Statistics for Engineering and th…
Statistics
ISBN:
9781305251809
Author:
Jay L. Devore
Publisher:
Cengage Learning
Statistics for The Behavioral Sciences (MindTap C…
Statistics
ISBN:
9781305504912
Author:
Frederick J Gravetter, Larry B. Wallnau
Publisher:
Cengage Learning

Elementary Statistics: Picturing the World (7th E…
Statistics
ISBN:
9780134683416
Author:
Ron Larson, Betsy Farber
Publisher:
PEARSON

The Basic Practice of Statistics
Statistics
ISBN:
9781319042578
Author:
David S. Moore, William I. Notz, Michael A. Fligner
Publisher:
W. H. Freeman

Introduction to the Practice of Statistics
Statistics
ISBN:
9781319013387
Author:
David S. Moore, George P. McCabe, Bruce A. Craig
Publisher:
W. H. Freeman