1. A community-based intervention program for hypertension was undertaken in two communities to compare the effect of a non-pharmacological and pharmacologic interventions for mild to moderate hypertension. A baseline survey was conducted which yielded the following results: Community A Community B Smoking Habit Hypertensive Normotensive Hypertensive Normotensive Smoker 698 1,325 709 1,342 Non-smoker 748 7,862 885 8,450 ТОTAL 10,633 11,386 а) What is the prevalence of each of the two communities?
1. A community-based intervention program for hypertension was undertaken in two communities to compare the effect of a non-pharmacological and pharmacologic interventions for mild to moderate hypertension. A baseline survey was conducted which yielded the following results: Community A Community B Smoking Habit Hypertensive Normotensive Hypertensive Normotensive Smoker 698 1,325 709 1,342 Non-smoker 748 7,862 885 8,450 ТОTAL 10,633 11,386 а) What is the prevalence of each of the two communities?

Glencoe Algebra 1, Student Edition, 9780079039897, 0079039898, 2018
18th Edition
ISBN:9780079039897
Author:Carter
Publisher:Carter
Chapter4: Equations Of Linear Functions
Section: Chapter Questions
Problem 8SGR

Related questions
Question
100%
FOLLOW THE INSTRUCTIONS
TYPEWRITTEN ONLY PLEASE FOR UPVOTE. DOWNVOTE FOR HANDWRITTEN. DO NOT ANSWER IF YOU ALREADY ANSWERED THISFOLLOW THE INSTRUCTIONS
TYPEWRITTEN ONLY PLEASE FOR UPVOTE. DOWNVOTE FOR HANDWRITTEN. DO NOT ANSWER IF YOU ALREADY ANSWERED THIS
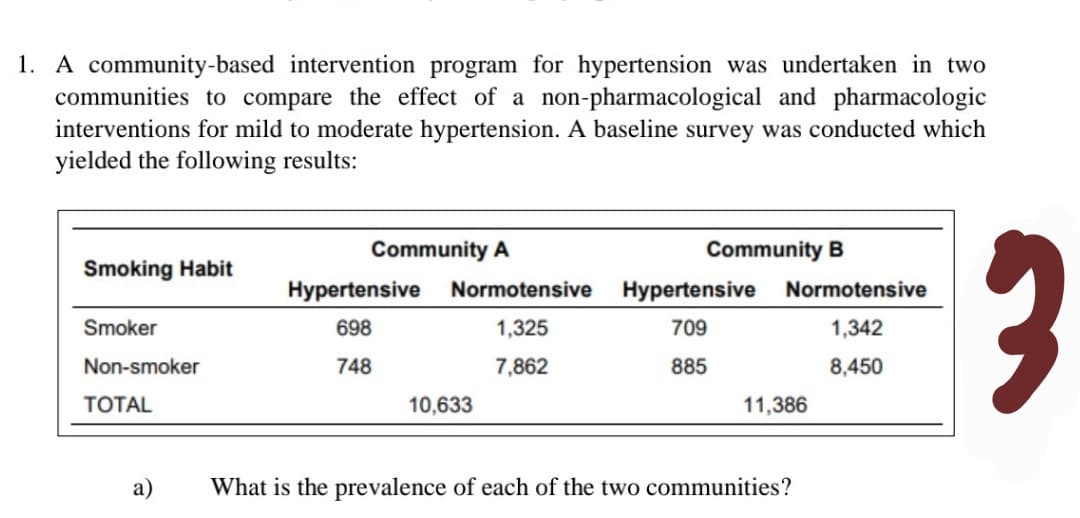
Transcribed Image Text:1. A community-based intervention program for hypertension was undertaken in two
communities to compare the effect of a non-pharmacological and pharmacologic
interventions for mild to moderate hypertension. A baseline survey was conducted which
yielded the following results:
Community A
Community B
Smoking Habit
Hypertensive
Normotensive
Hypertensive
Normotensive
Smoker
698
1,325
709
1,342
Non-smoker
748
7,862
885
8,450
ТОTAL
10,633
11,386
a)
What is the prevalence of each of the two communities?
Expert Solution
This question has been solved!
Explore an expertly crafted, step-by-step solution for a thorough understanding of key concepts.

Step by step
Solved in 2 steps

Recommended textbooks for you
Glencoe Algebra 1, Student Edition, 9780079039897…
Algebra
ISBN:
9780079039897
Author:
Carter
Publisher:
McGraw Hill
Glencoe Algebra 1, Student Edition, 9780079039897…
Algebra
ISBN:
9780079039897
Author:
Carter
Publisher:
McGraw Hill