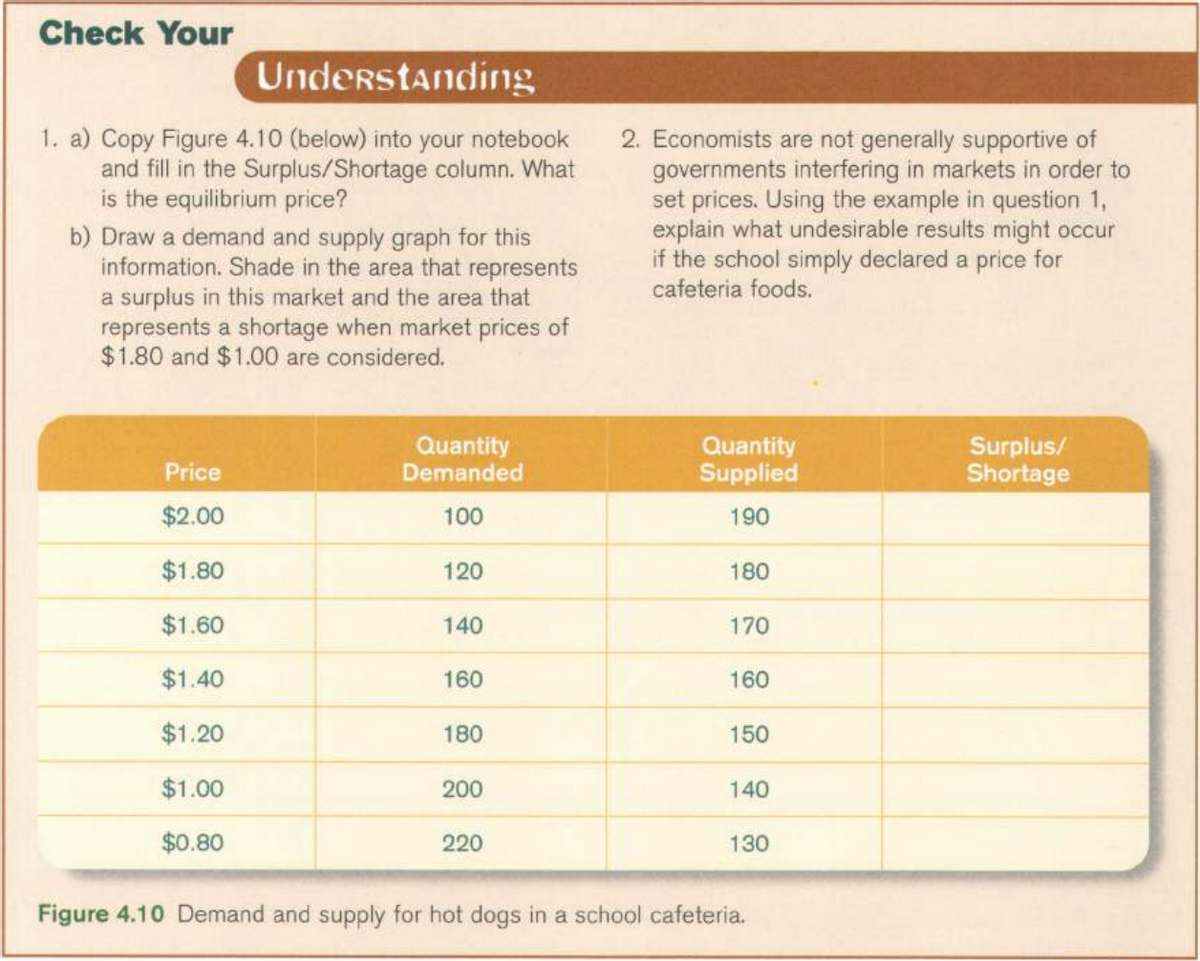
1. a) Copy Figure 4.10 (below) into your notebook and fill in the Surplus/Shortage column. What is the equilibrium price? b) Draw a demand and supply graph for this information. Shade in the area that represents a surplus in this market and the area that represents a shortage when market prices of $1.80 and $1.00 are considered.


Q: Explain and illustrate using isoquants and isocosts how a firm that is currently using the least…
A: For a given isoquant, firm is trying to minimize the cost of production using the inputs…
Q: For some years, Mel has contracted with several major pizza retailers for home delivery services. He…
A: Given, Two Delivery Services : Current Van and New VanMARR : 12% Current Van : Purchased 10 years…
Q: In a perfectly competitive market for a good with a downward sloping demand curve and an upward…
A: The measure that depicts benefits or costs that are not being not received or incurred financially…
Q: 201 11. Determine the IRR for an equipment that costs $250,000 and would provide positive cash of…
A: Since on the top you mentioned 11, I'm solving the 11th question only. Note:- i'm using the trial…
Q: Suppose that low-skilled workers employed in clearing woodland can each clear one acre per month if…
A: Marginal revenue product (MRP) is the marginal revenue created by using one additional unit of…
Q: Find the present value of a PHP 120,000 annuity payable every year for 10 but deferred 3 years.…
A: The given values Deferred years (t)=3 Annuity payable years(n)=10 Annuity value (A)=120000 money…
Q: Keynesian economists assert that a GDP gap = $6 trillion needs an increase in government spending of…
A: The GDP change is higher than the change in government spending because of the multiplier effect.
Q: Suppose in the market for gasoline the demand is given by P = 8000 – Qd and the supply is given by P…
A: With the negative production externality, SMC becomes more than PMC
Q: 1. Draw five aggregate supply and demand graphs at long run equilibrium. Illustrate what would…
A: The aggregate demand–aggregate supply model, often known as the AD–AS model, is a macroeconomic…
Q: According to the Keynesian ideas on Aggregate Demand, a macroeconomist would most likely expect…
A: Interest rate: - it is the percentage charge on the principal amount by a lender to a borrower
Q: First degree price discrimination is the same as O pricing for personnel. O personal discrimination.…
A: The measure that depicts charging different prices for the same services or products being sold is…
Q: The maker of a leading brand of low-calorie microwavable food estimated the following demand…
A: Given, Assume the following values for the independent variables: Q = Quantity sold per month P (in…
Q: 7. Use of discretionary policy to stabilize the economy Should the government use monetary and…
A: Aggregate demand- aggregate supply model determines the equilibrium real GDP.
Q: SLO-4.1. The amount of money people have to spend after buying necessities such as food, clothing…
A: People has income which they spend of different types of goods such as on necessary goods and…
Q: Types of Circular Flow of Income in Economics
A: In an economy, the circular flow refers to the never-ending flow of goods and services produced and…
Q: Company A will pay dividends according to the following Time Dividend amounts 1 $10 2 $7 3 $6 $2.75…
A: Answer; Value of share is equal to $36.10
Q: Discuss the impact of long run on cost of doing business.
A: Meaning of Cost: The term cost refers to the situation under which a firm occurs various expenses…
Q: -20 40 Enter 50 10 0 0 s the payoff to two airlines, A and B, of serving a particular route. If the…
A: *Answer: Explanation : According to the given conditions, Before tax firm A has a dominant strategy…
Q: In one way, the impact of immigration and inward foreign direct investment are structurally the same…
A: Labor refers to the portion of the population that works or are looking for employment. It is also…
Q: ’The dynamics of the Law of Contract as per the Code Civil is ,but, a myth’’. Assess the pertinence…
A: In addition, the page summarises the laws governing employment relationships, including redundancies…
Q: lgs Review view Help 5-7.D(x) = 2(x-3)² is the price, in dollars per unit, that consumers will pay…
A: * SOLUTION :-
Q: There are two consumers and two goods (A and B) in a competitive economy. At the competitive…
A: Individuals (consumers) directly involved in the acquisition, use, and disposal of economic goods…
Q: Prospect Y = ($4, 0.25 ; $16, 0.75) If Will's utility of wealth function is given by u(x)=x0.25,…
A: Prospect Y = ($4, 0.25 ; $16, 0.75) And Will's utility of wealth function is given by u(x)=x0.25
Q: coordinate their be A collusion agreement that requires firms to have some sort of communication in…
A: The firms and businesses tend to operate in the markets where the make up the supply side as they…
Q: The management of a large fast food chain evaluates the supplier of their deep---frozen beef…
A: Standard Deviation Standard deviation in this condition implies to the variance that happens in the…
Q: No matter the macroeconomic conditions in an economy, a Keynesian economist always advocates for…
A: No matter the macroeconomic conditions in an economy, a Keynesian economist always advocates for…
Q: High tax rates that put money into the government's funds tend to slow spending, and ultimately slow…
A: Tax: The word tax refers to the compulsory payment which is imposed by the government. It is also an…
Q: hould .trade movie tickets for basketball tickets because his marginal utility per dollar spent on…
A: Marginal utility is the additional fulfillment that a customer gets from having another unit of a…
Q: 1. George maximizes expected utility and he has a von-Neumann-Morgenstern utility function u (c) =…
A: Utility = c1/2 Initial Wealth = $1000 success rate = 9% If successful then payoff = $100,000 Payoff…
Q: What are the strengths and weaknesses for establishing base pay in international contexts for host…
A: Base wages is the underlying wages paid to a worker, excluding any advantages, rewards, or raises.…
Q: Market solutions would take too long
A: John Maynard Keynes more focus on demand side to come out from recession. He believe demand creates…
Q: The division director for Sandhill Corporation's Mississippi division, which operates as an…
A: EVA is a measure of a company's financial success based on the residual wealth derived by deducting…
Q: nterpret and explain, diagram of effect of airline regulation by the civil aeronautic board indicate…
A: Civil aviation, which has been heavily regulated by European governments, is one of the industries…
Q: competition Consider the monopolistically competitive market structure, which has some features of a…
A: Introduction 1. Price-takers are prevalent in most competitive markets. Consumers will just obtain…
Q: Required information An officer of the state lottery commission has sampled lottery ticket…
A: Probability refers to the fraction of likelihood of an event occurring from a set of possible…
Q: The Federal Reserve will: A increase government spending to increase AD B increase taxes to increase…
A: The Federal Reserve uses monetary policy to stabilize the economy. Monetary policy changes the money…
Q: An example of fiscal policy is: A) decrease in the exchange rate OB) decrease in the price level C)…
A: Since you have asked multiple question, we will solve the first question for you. If you want any…
Q: A cartel can be formed as a tacit collusion when: none of the other answers are correct. firms…
A: Tacit Collusion : The situation of tacit collusion cartel can be defined as when the competitors do…
Q: stina's Costs and Revenue mantity Average Variable Average Total Cost (dollars) Marginal Cost…
A: In monetary hypothesis, perfect competition happens when all organizations sell indistinguishable…
Q: Resource development is Multiple Choice the part of economics that looks at the operation of a…
A: Resource development refers to the development of resources in an economy. Resources should be used…
Q: The Shell Corporation has a 34% tax rate and owns a piece of petroleum-drilling equipment that costs…
A: Given information First cost=$119000 Annual revenue=$33100 Salvage value=$31600 CCA rate=30% Tax…
Q: suppose a small economy produces only smart TVs. in year one, 10,000 TVs are produced and sold at a…
A: Year 1 TV produced = 10,000 Sales Price = 1000 Year 2 TV Produced = 10,000 Sales Price = 1500
Q: The task to complete is to create a scenario in which a monopoly might form and analyze that…
A: Market refers to the place where the buyers or sellers come together to meet each other for…
Q: In a monopolist group pricing setting, the monopolist optimally charges. with a elasticity of…
A: Monopoly firm practises price discrimination to raise the level of profit. Price firm charges…
Q: forces at play: and effects. cubic Hotelling; competition; market size quadratic Hotelling;…
A: In a market, there are various sorts of management system utilized by the firms while managing the…
Q: Why might a firm have monopoly power even if it is not the only producer in the market? O A. There…
A: The markets are the place where the buyers and the suppliers of various products meet and interact…
Q: What is skeumorph?
A: Total Revenue: The sum of all revenues or the revenue that is collected by selling all the…
Q: Consider an AS AD diagram. What would happen in the model if Stock values decreased? Group of…
A: AD-AS model is used to determine equilibrium real GDP and price level.
Q: Consider the following game, which is played simultaneously: B 1 1 -1 A 2 1 What type of game this…
A: We have 2×2 game where players have action 1 and 2. And they are moving simultaneously.
Q: Identify and discuss the micro environment factors that affects DHL express performance and decision…
A: The macro factors includes the conditions of a country and these conditions includes whether the…
Could you help me with question 1.


Trending now
This is a popular solution!

Step by step
Solved in 3 steps with 1 images


- According to a researcher at the FDA, vegan foods are “the way if the future”. Morepersons have become health conscious and are looking for foods which will fit thislifestyle. One such food is the Beyond Burger, a plant-based alternative to beef. Notably,despite strong demand for beef burgers, the supply chain has seen a host of disruptionsthat are preventing producers from getting their products to market.Beyond Burger’s sales in Canada totaled $3.0 billion at the end of 2021, accounting for20% of all retail sales of burger patties (meat used in burgers), and 40% of the largermarket for vegan foods. By the end of 2025, sales of Beyond Burgers are projected to makeup 40% of all burger sales.i. Illustrate and explain the effect of the increased use of Beyond Burgers on (i) theburger patties market and (ii) the vegan market.warring ( i just want the answer for C ) A- Given the following two equations:Qd = 150 – 3PQs = 70 + 2P Calculate the equilibrium price and the equilibrium quantity. Show all your work.B- Using the above two equations to find the values of Qd, Qs, the market situation (Shortage/Surplus/Equilibrium), and the Value of shortage or surplus if any, at the following prices.10, 15,20 and 25. C-If the consumer income increases by 20%, what will happen to the equilibrium price and quantity. warring ( i just want the answer for C )1) In the market for smart phones, explain how will thefollowing statement impact the equilibrium price andquantity?Average incomes increase and new technology improvesproductive efficiency(Make sure that you also consider the effect on demandand supply curves where appropriate)
- Suppose that in the citrus market, while the amount of production decreased due to cold winter conditions, consumers' desire to drink citrus juice increased in order to strengthen their immunity due to the COVID-19 epidemic. In this case, how is the equilibrium price and quantity affected in the citrus market? Evaluate this with the help of the figure for the case where the supply curve shifts more than the demand curve. (Note: Do not forget to write the names of the axes while drawing the figure. Show clearly the supply-demand curve and the market equilibrium point in the first case and the supply-demand curve and equilibrium point after the shift.)Determine whether each of the following statementsis true, false, or uncertain. Then briefly explain each answer.a. In equilibrium, all sellers can find buyers.b. In equilibrium, there is no pressure on the market to produce orconsume more than is being sold.c. At prices above equilibrium, the quantity exchanged exceeds thequantity demanded.d. At prices below equilibrium, the quantity exchanged is equal tothe quantity suppliedMarket researches have studied the market for milk,and their estimates for the supply of and the demand for milk per month are as follows:a.Using the data,graph the demand for and the supply for milk.Identify the equilibrium point as E,and use dotted lines to connect E to the equilibrium price onthe price axis and the equilibrium quantity on the quantity axis.b.Suppose the government enacts amilk price support of $8per gallon.Indicate this action on your graph,and explain the effect on the milk market?Why would the government establish such a price support?c.Now assume the government decides to set a price ceiling of $4 dollar per gallon.Show and explain how this legal price effects your graph of the milk market.What objective could the government be trying to achieve by establishing such a price ceiling?
- One of the largest changes in the economy over thepast several decades is that technological advanceshave reduced the cost of making computers.a. Draw a supply-and-demand diagram to showwhat happened to price, quantity, consumersurplus, and producer surplus in the market forcomputers.b. Forty years ago, students used typewriters toprepare papers for their classes; today theyuse computers. Does that make computersand typewriters complements or substitutes?Use a supply-and-demand diagram to showwhat happened to price, quantity, consumersurplus, and producer surplus in the marketfor typewriters. Should typewriter producershave been happy or sad about the technologicaladvance in computers?c. Are computers and software complements orsubstitutes? Draw a supply-and-demand diagramto show what happened to price, quantity,consumer surplus, and producer surplus in themarket for software. Should software producershave been happy or sad about the technologicaladvance in computers?d. Does this…Consider each of the scenarios before, and explain what the effect of the given changes would be on the market for the good in bold that was originally in equilibrium. State which curve(s) shift (supply, demand, both, neither), and whether price and quantity are higher or lower after the change, or if this is not possible to determine. (a) An increase in the cost of dorm rooms on the market for apartments in the U-district? (b) The government increases the consumption tax rate for consumersp by 5% on the market for Rolex watches? (c) The increase in price of milk on cakes? Note: The solution should not be hand written.How would each event affect the market for COVID-19 vaccines? Does the event cause a change in demand or a change in the quantity demanded? Is the change positive or negative? Or does the event cause a change in supply or a change in the quantity supplied? Is the change positive or negative? Explain the mechanism for the change and what happens to equilibrium price and quantity. a) The vaccine is approved for children under the age of 12. b) The U.S. government provides a subsidy that allows the price of the vaccine to be $0 for everyone. c) Several vaccines pass Phase 3 (large-scale efficacy tests) and are approved by the FDA for full use. d) A truck carrying the Pfizer vaccine has a malfunction and the refrigeration requirements aren’t met, so all the doses go bad. e) School districts and health care facilities add a requirement for getting the vaccine for all employees.
- Assume that each of the markets below is initially in equilibrium. Then for each market below, suppose that the indicated scenario occurs. Illustrate the effect of each event in a diagram and indicate the effects on the equilibrium price and quantity. d. Market: Caffeinated beverages. Scenario: Starbucks opens a franchise in St. Lucia. e. Market: Cigars Scenario: The government places a tax on cigar producers to discourage smoking coupled with the private sector running ad campaigns on the detrimental effects of smoking f. Market: Ketchup. Scenario: Insects kill half the nation’s tomato cropA recent study found that the demand-and-supplyschedules for Frisbees arc as follows: a. Wha t arc the equilibrium price and quantity ofFrisbees?b. Frisbee manufacturers persuade the governmentthat Frisbee production improves scientists' understanding of aerodynamics and thus is import•ant for national security. A concerned Congressvotes to impose a price floor $2 above the equilibrium price. What is the ne·w market price? Howmany Frisbees arc sold 7c. Irate college students marcl, on Washington anddemand a reduction in the price of Frisbees. Aneven more concerned Congress vo tes to repeal the price floor and impose a price ceiling $1 below theformer price floor. Wha t is the new market price?How man}' Frisbees arc sold?There are 40 people living in a village each having preference over apples andshirts represented by U(a,b) = a1/3s2/3, where a and s are amount of applesin pounds and shirts consumed, respectively. The price of a shirt is $10. Each villager has $300 income. Apples are supplied to the village by a farmer, whose supply function is S(pa) = 1000pa.Part a1What is the equilibrium price of apples? How many pounds of apples does eachvillager consume?Part a2What is the aggregate net consumer surplus at the equilibrium?Part a3What is the price elasticity of demand at the equilibrium?Part b1Suppose 50 more people move in to the village. What is the equilibrium pricenow? Part b2Are consumers better or worse off now? Why? If a consumer is worse off, byhow much additional income he/she needs to be compensated in order to be aswell off as in Part a.
