1. (a) Interpreting the data given above, compare the economic indicators in Norway from 2007 to 2021. What can you say about the economic growth of the county? (b) Using the aggregate demand and aggregate supply curves, draw a diagram showing the GDP and Price levels in 2007 and 2021.
1. (a) Interpreting the data given above, compare the economic indicators in Norway from 2007 to 2021. What can you say about the economic growth of the county? (b) Using the aggregate demand and aggregate supply curves, draw a diagram showing the GDP and Price levels in 2007 and 2021.

Essentials of Economics (MindTap Course List)
8th Edition
ISBN:9781337091992
Author:N. Gregory Mankiw
Publisher:N. Gregory Mankiw
Chapter17: Production And Growth
Section: Chapter Questions
Problem 8QR

Related questions
Question

Transcribed Image Text:1. (a) Interpreting the data given above, compare the economic indicators in Norway from 2007
to 2021. What can you say about the economic growth of the county?
(b) Using the aggregate demand and aggregate supply curves, draw a diagram showing the
GDP and Price levels in 2007 and 2021.
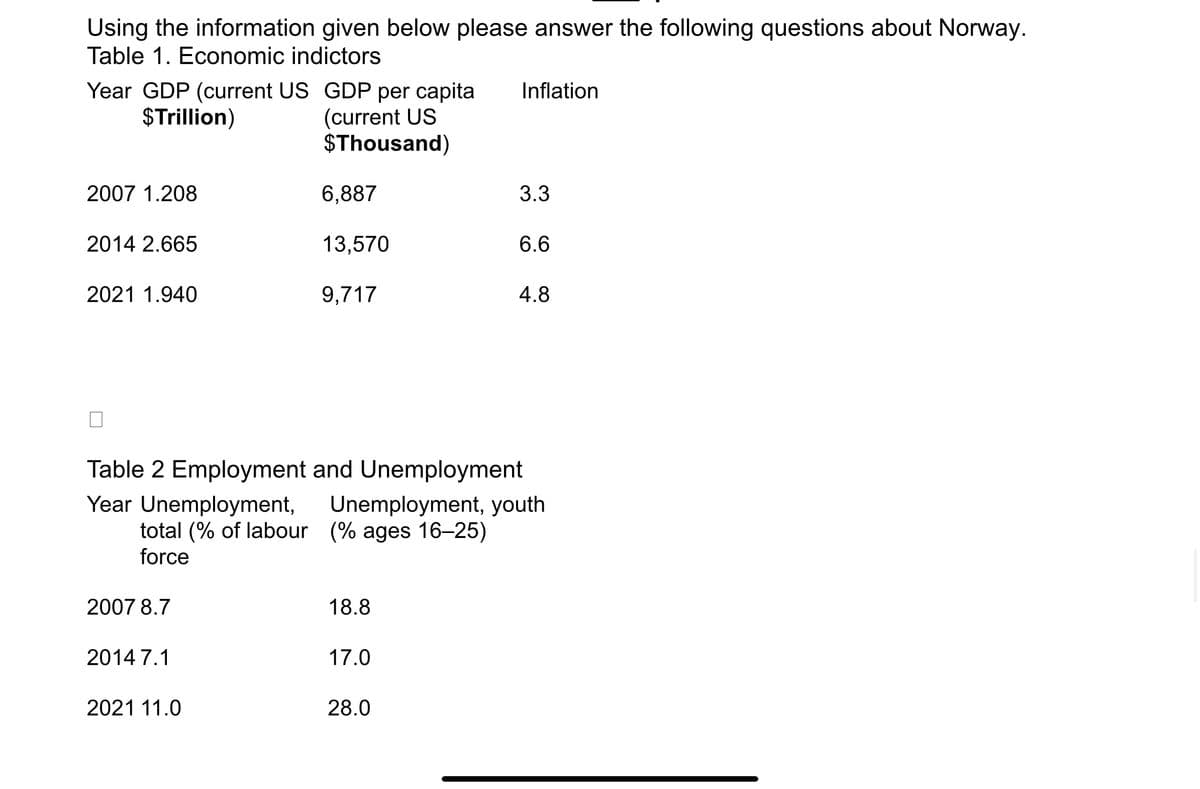
Transcribed Image Text:Using the information given below please answer the following questions about Norway.
Table 1. Economic indictors
Year GDP (current US GDP per capita
Inflation
$Trillion)
(current US
$Thousand)
2007 1.208
6,887
3.3
2014 2.665
13,570
6.6
2021 1.940
9,717
4.8
0
Table 2 Employment and Unemployment
Year Unemployment, Unemployment, youth
total (% of labour (% ages 16-25)
force
2007 8.7
18.8
2014 7.1
17.0
2021 11.0
28.0
Expert Solution
This question has been solved!
Explore an expertly crafted, step-by-step solution for a thorough understanding of key concepts.

Step by step
Solved in 3 steps with 1 images

Knowledge Booster


Learn more about
Need a deep-dive on the concept behind this application? Look no further. Learn more about this topic, economics and related others by exploring similar questions and additional content below.Recommended textbooks for you
Essentials of Economics (MindTap Course List)
Economics
ISBN:
9781337091992
Author:
N. Gregory Mankiw
Publisher:
Cengage Learning

Brief Principles of Macroeconomics (MindTap Cours…
Economics
ISBN:
9781337091985
Author:
N. Gregory Mankiw
Publisher:
Cengage Learning

Essentials of Economics (MindTap Course List)
Economics
ISBN:
9781337091992
Author:
N. Gregory Mankiw
Publisher:
Cengage Learning
Brief Principles of Macroeconomics (MindTap Cours…
Economics
ISBN:
9781337091985
Author:
N. Gregory Mankiw
Publisher:
Cengage Learning


Principles of Economics 2e
Economics
ISBN:
9781947172364
Author:
Steven A. Greenlaw; David Shapiro
Publisher:
OpenStax