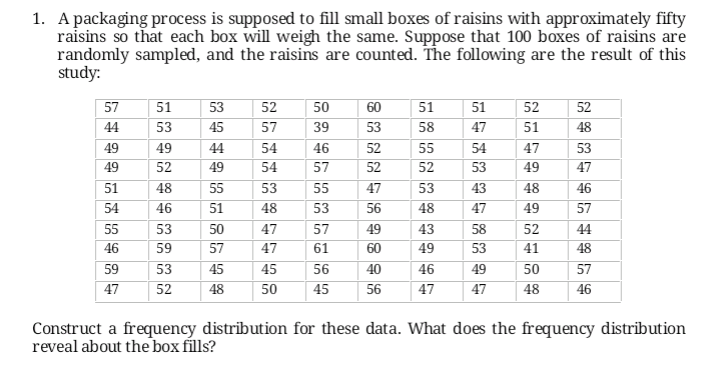
1. A packaging process is supposed to fill small boxes of raisins with approximately fifty raisins so that each box will weigh the same. Suppose that 100 boxes of raisins are randomly sampled, and the raisins are counted. The following are the result of this study: 57 51 53 52 50 60 51 51 52 52 44 53 45 57 39 53 58 47 51 48 49 49 44 54 46 52 55 54 47 53 49 52 49 54 57 52 52 53 49 47 51 48 55 53 55 47 53 43 48 46 54 46 51 48 53 56 48 47 49 57 55 53 50 47 57 49 43 58 52 44 46 59 57 47 61 60 49 53 41 48 59 53 45 45 56 40 46 49 50 57 47 52 48 50 45 56 47 47 48 46 Construct a frequency distribution for these data. What does the frequency distribution reveal about the box fílls?
1. A packaging process is supposed to fill small boxes of raisins with approximately fifty raisins so that each box will weigh the same. Suppose that 100 boxes of raisins are randomly sampled, and the raisins are counted. The following are the result of this study: 57 51 53 52 50 60 51 51 52 52 44 53 45 57 39 53 58 47 51 48 49 49 44 54 46 52 55 54 47 53 49 52 49 54 57 52 52 53 49 47 51 48 55 53 55 47 53 43 48 46 54 46 51 48 53 56 48 47 49 57 55 53 50 47 57 49 43 58 52 44 46 59 57 47 61 60 49 53 41 48 59 53 45 45 56 40 46 49 50 57 47 52 48 50 45 56 47 47 48 46 Construct a frequency distribution for these data. What does the frequency distribution reveal about the box fílls?

Glencoe Algebra 1, Student Edition, 9780079039897, 0079039898, 2018
18th Edition
ISBN:9780079039897
Author:Carter
Publisher:Carter
Chapter10: Statistics
Section10.4: Distributions Of Data
Problem 19PFA

Related questions
Question
Need help. I badly need it
Transcribed Image Text:1. A packaging process is supposed to fill small boxes of raisins with approximately fifty
raisins so that each box will weigh the same. Suppose that 100 boxes of raisins are
randomly sampled, and the raisins are counted. The following are the result of this
study:
57
51
53
52
50
60
51
51
52
52
57
54
54
44
53
45
39
53
58
47
51
48
49
49
44
46
52
55
54
47
53
49
52
49
57
52
52
53
49
47
51
48
55
53
55
47
53
43
48
46
54
46
51
48
53
56
48
47
49
57
55
53
50
47
57
49
43
58
52
44
46
59
57
47
61
60
49
53
41
48
59
53
45
45
56
40
46
49
50
57
47
52
48
50
45
56
47
47
48
46
Construct a frequency distribution for these data. What does the frequency distribution
reveal about the box fills?
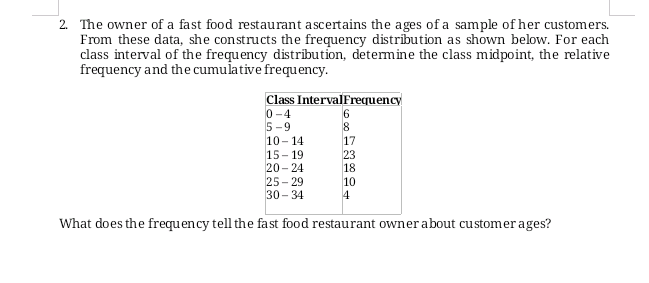
Transcribed Image Text:2. The owner of a fast food restaurant ascertains the ages of a sample of her customers.
From these data, she constructs the frequency distribution as shown below. For each
class interval of the frequency distribution, detemine the class midpoint, the relative
frequency and the cumulative frequency.
Class IntervalFrequency
0-4
5-9
10- 14
15 - 19
20- 24
6
8
17
23
18
25 - 29
30 - 34
4
What does the frequency tell the fast food restaurant owner about customerages?
Expert Solution
This question has been solved!
Explore an expertly crafted, step-by-step solution for a thorough understanding of key concepts.

This is a popular solution!

Trending now
This is a popular solution!

Step by step
Solved in 2 steps with 1 images

Recommended textbooks for you
Glencoe Algebra 1, Student Edition, 9780079039897…
Algebra
ISBN:
9780079039897
Author:
Carter
Publisher:
McGraw Hill
Glencoe Algebra 1, Student Edition, 9780079039897…
Algebra
ISBN:
9780079039897
Author:
Carter
Publisher:
McGraw Hill