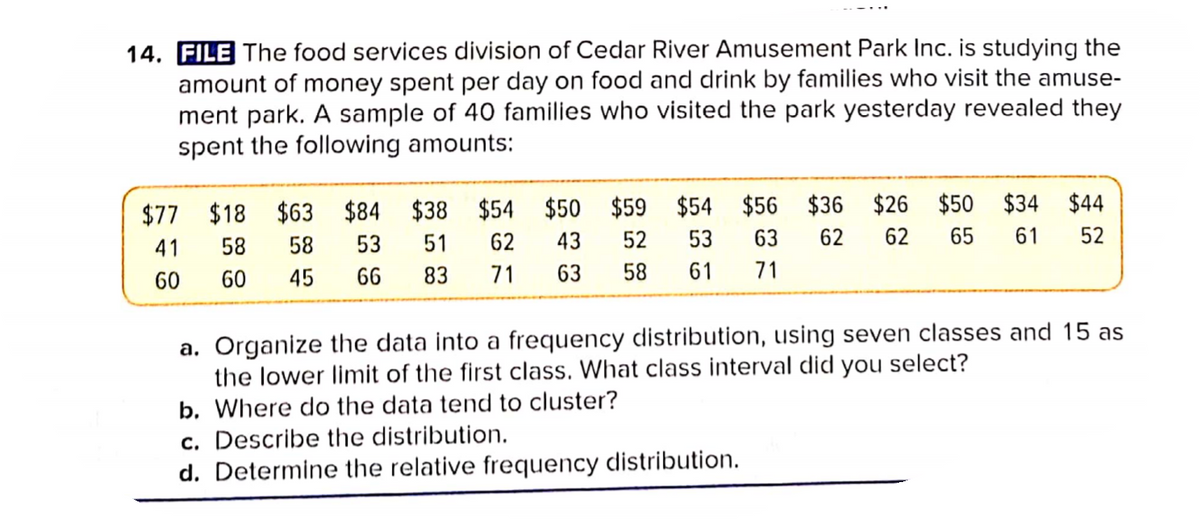
14. FILE The food services division of Cedar River Amusement Park Inc. is studying the amount of money spent per day on food and drink by families who visit the amuse- ment park. A sample of 40 families who visited the park yesterday revealed they spent the following amounts: $77 $18 $63 $84 $38 $54 $50 $59 $54 $56 $36 $26 $50 $34 $44 41 58 58 53 51 62 43 52 53 63 62 62 65 61 52 60 60 45 66 83 71 63 58 61 71 a. Organize the data into a frequency distribution, using seven classes and 15 as the lower limit of the first class. What class interval did you select? b. Where do the data tend to cluster? c. Describe the distribution. d. Determine the relative frequency distribution.
14. FILE The food services division of Cedar River Amusement Park Inc. is studying the amount of money spent per day on food and drink by families who visit the amuse- ment park. A sample of 40 families who visited the park yesterday revealed they spent the following amounts: $77 $18 $63 $84 $38 $54 $50 $59 $54 $56 $36 $26 $50 $34 $44 41 58 58 53 51 62 43 52 53 63 62 62 65 61 52 60 60 45 66 83 71 63 58 61 71 a. Organize the data into a frequency distribution, using seven classes and 15 as the lower limit of the first class. What class interval did you select? b. Where do the data tend to cluster? c. Describe the distribution. d. Determine the relative frequency distribution.

MATLAB: An Introduction with Applications
6th Edition
ISBN:9781119256830
Author:Amos Gilat
Publisher:Amos Gilat
Chapter1: Starting With Matlab
Section: Chapter Questions
Problem 1P

Related questions

Concept explainers
Contingency Table
A contingency table can be defined as the visual representation of the relationship between two or more categorical variables that can be evaluated and registered. It is a categorical version of the scatterplot, which is used to investigate the linear relationship between two variables. A contingency table is indeed a type of frequency distribution table that displays two variables at the same time.
Binomial Distribution
Binomial is an algebraic expression of the sum or the difference of two terms. Before knowing about binomial distribution, we must know about the binomial theorem.
Topic Video
Question
100%
14
Transcribed Image Text:14. FILE The food services division of Cedar River Amusement Park Inc. is studying the
amount of money spent per day on food and drink by families who visit the amuse-
ment park. A sample of 40 families who visited the park yesterday revealed they
spent the following amounts:
$77 $18 $63 $84 $38 $54 $50 $59 $54 $56 $36 $26 $50
43
$34 $44
41
58
58
53
51
62
52
53
63
62
62
65
61
52
60
60
45
66
83
71
63
58
61
71
a. Organize the data into a frequency distribution, using seven classes and 15 as
the lower limit of the first class. What class interval did you select?
b. Where do the data tend to cluster?
c. Describe the distribution.
d. Determine the relative frequency distribution.
Expert Solution
This question has been solved!
Explore an expertly crafted, step-by-step solution for a thorough understanding of key concepts.

This is a popular solution!

Trending now
This is a popular solution!

Step by step
Solved in 2 steps

Knowledge Booster


Learn more about
Need a deep-dive on the concept behind this application? Look no further. Learn more about this topic, statistics and related others by exploring similar questions and additional content below.Recommended textbooks for you
MATLAB: An Introduction with Applications
Statistics
ISBN:
9781119256830
Author:
Amos Gilat
Publisher:
John Wiley & Sons Inc

Probability and Statistics for Engineering and th…
Statistics
ISBN:
9781305251809
Author:
Jay L. Devore
Publisher:
Cengage Learning

Statistics for The Behavioral Sciences (MindTap C…
Statistics
ISBN:
9781305504912
Author:
Frederick J Gravetter, Larry B. Wallnau
Publisher:
Cengage Learning
MATLAB: An Introduction with Applications
Statistics
ISBN:
9781119256830
Author:
Amos Gilat
Publisher:
John Wiley & Sons Inc
Probability and Statistics for Engineering and th…
Statistics
ISBN:
9781305251809
Author:
Jay L. Devore
Publisher:
Cengage Learning
Statistics for The Behavioral Sciences (MindTap C…
Statistics
ISBN:
9781305504912
Author:
Frederick J Gravetter, Larry B. Wallnau
Publisher:
Cengage Learning

Elementary Statistics: Picturing the World (7th E…
Statistics
ISBN:
9780134683416
Author:
Ron Larson, Betsy Farber
Publisher:
PEARSON

The Basic Practice of Statistics
Statistics
ISBN:
9781319042578
Author:
David S. Moore, William I. Notz, Michael A. Fligner
Publisher:
W. H. Freeman

Introduction to the Practice of Statistics
Statistics
ISBN:
9781319013387
Author:
David S. Moore, George P. McCabe, Bruce A. Craig
Publisher:
W. H. Freeman