1. A quality analyst wants to construct a sample mean and range charts for controlling a packaging process. He knows from past experience that when the process is op- erating as intended, packaging weight is normally distributed with a mean of twenty ounces, and a process standard devia- tion of two ounces. Each day last week, he randomly selected 2. Pairs of Yeezy sneakers are supposed to weigh exactly four packages and weighed each. The data he collected ap- pear below in ounces. (b) With a value of z that would provide 99.73% confidence, construct an Xbar and R charts for this process. what do you conclude about the process – is it in control? Answer: Ikg. Inspectors want to develop process control charts. They take ten samples of six pairs each and weigh them. Based on the following data (in kg), compute the lower and upper control limits and determine whether the process is in control. Note that the overall standard deviation of the population is un- known. Day Package 1 Package 2 Package 3 Package 4 Moaday 23 22 23 24 Tuesday 23 21 19 21 Wedaesday 20 19 20 21 Thursday 18 19 20 19 Friday 18 20 22 20 Sample Mean Range 120 (a) If he sets an upper control limit of 21 and a lower control limit of 19 around the target value of 20 ounces, the control chart is based on what value of z? 90 80 1.10 1.00 130 10 Answer: 95 1.20 10 1.45
1. A quality analyst wants to construct a sample mean and range charts for controlling a packaging process. He knows from past experience that when the process is op- erating as intended, packaging weight is normally distributed with a mean of twenty ounces, and a process standard devia- tion of two ounces. Each day last week, he randomly selected 2. Pairs of Yeezy sneakers are supposed to weigh exactly four packages and weighed each. The data he collected ap- pear below in ounces. (b) With a value of z that would provide 99.73% confidence, construct an Xbar and R charts for this process. what do you conclude about the process – is it in control? Answer: Ikg. Inspectors want to develop process control charts. They take ten samples of six pairs each and weigh them. Based on the following data (in kg), compute the lower and upper control limits and determine whether the process is in control. Note that the overall standard deviation of the population is un- known. Day Package 1 Package 2 Package 3 Package 4 Moaday 23 22 23 24 Tuesday 23 21 19 21 Wedaesday 20 19 20 21 Thursday 18 19 20 19 Friday 18 20 22 20 Sample Mean Range 120 (a) If he sets an upper control limit of 21 and a lower control limit of 19 around the target value of 20 ounces, the control chart is based on what value of z? 90 80 1.10 1.00 130 10 Answer: 95 1.20 10 1.45

Practical Management Science
6th Edition
ISBN:9781337406659
Author:WINSTON, Wayne L.
Publisher:WINSTON, Wayne L.
Chapter2: Introduction To Spreadsheet Modeling
Section: Chapter Questions
Problem 20P: Julie James is opening a lemonade stand. She believes the fixed cost per week of running the stand...

Related questions
Question
please help answer part a and b for question 1. Please answer question 2 as well.
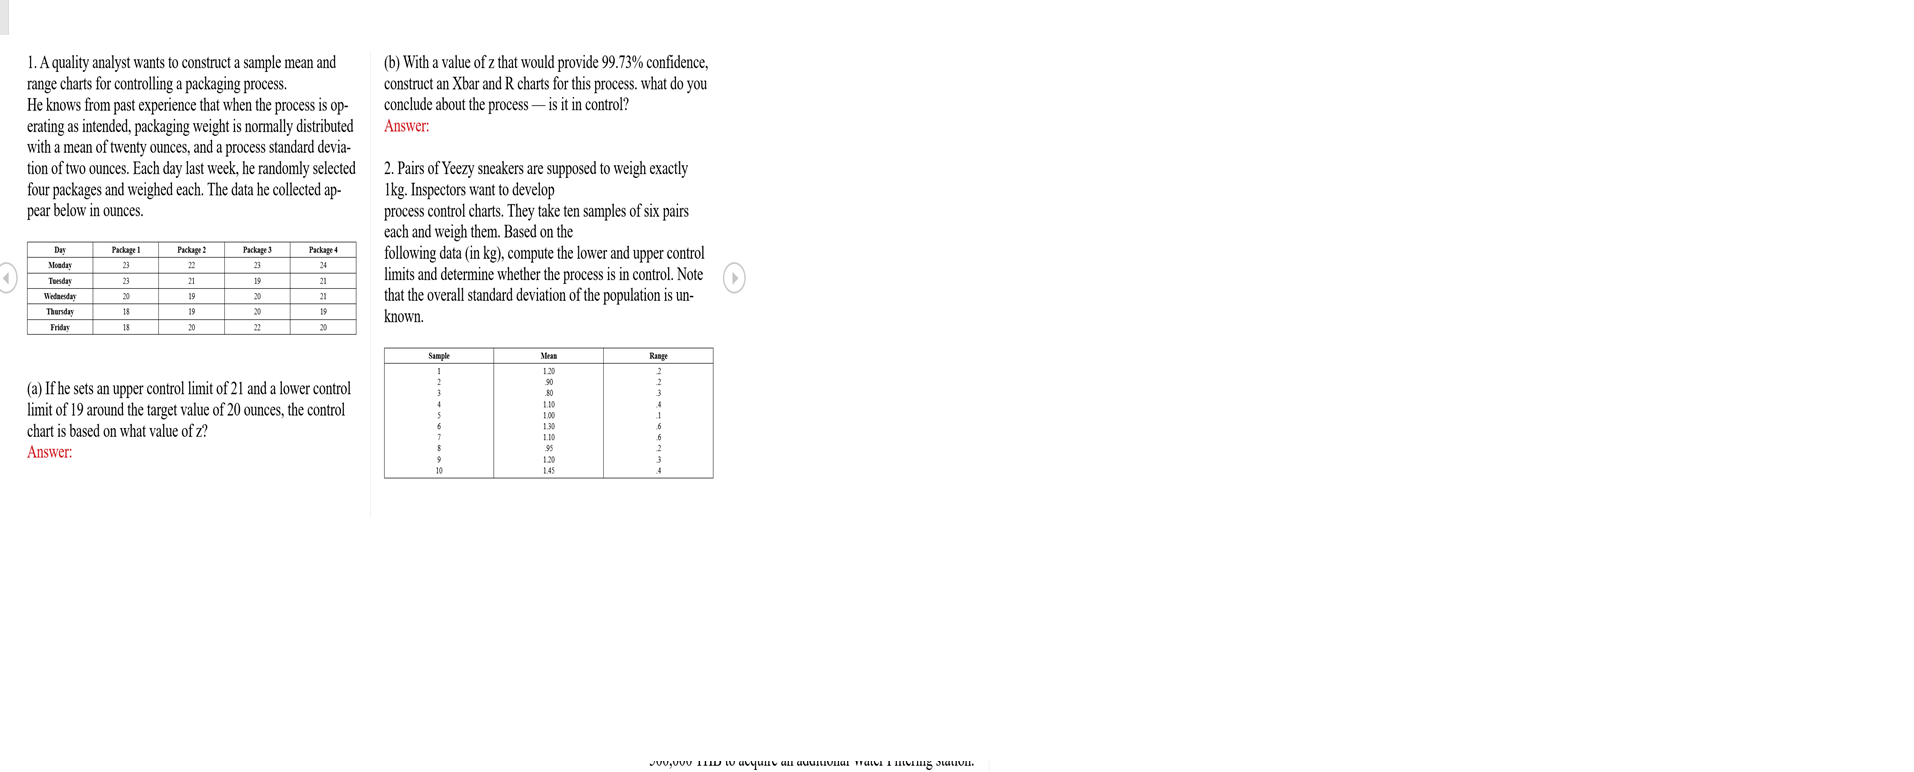
Transcribed Image Text:1. A quality analyst wants to construct a sample mean and
range charts for controlling a packaging process.
He knows from past experience that when the process is op-
erating as intended, packaging weight is normally distributed
with a mean of twenty ounces, and a process standard devia-
tion of two ounces. Each day last week, he randomly selected 2. Pairs of Yeezy sneakers are supposed to weigh exactly
four packages and weighed each. The data he collected ap-
pear below in ounces.
(b) With a value of z that would provide 99.73% confidence,
construct an Xbar and R charts for this process. what do you
conclude about the process – is it in control?
Answer:
Ikg. Inspectors want to develop
process control charts. They take ten samples of six pairs
each and weigh them. Based on the
following data (in kg), compute the lower and upper control
limits and determine whether the process is in control. Note
that the overall standard deviation of the population is un-
known.
Day
Package 1
Package 2
Package 3
Package 4
Moaday
23
22
23
24
Tuesday
23
21
19
21
Wedaesday
20
19
20
21
Thursday
18
19
20
19
Friday
18
20
22
20
Sample
Mean
Range
120
(a) If he sets an upper control limit of 21 and a lower control
limit of 19 around the target value of 20 ounces, the control
chart is based on what value of z?
90
80
1.10
1.00
130
10
Answer:
95
1.20
10
1.45
Expert Solution
This question has been solved!
Explore an expertly crafted, step-by-step solution for a thorough understanding of key concepts.

This is a popular solution!

Trending now
This is a popular solution!

Step by step
Solved in 5 steps

Knowledge Booster


Learn more about
Need a deep-dive on the concept behind this application? Look no further. Learn more about this topic, operations-management and related others by exploring similar questions and additional content below.Recommended textbooks for you
Practical Management Science
Operations Management
ISBN:
9781337406659
Author:
WINSTON, Wayne L.
Publisher:
Cengage,

Operations Management
Operations Management
ISBN:
9781259667473
Author:
William J Stevenson
Publisher:
McGraw-Hill Education

Operations and Supply Chain Management (Mcgraw-hi…
Operations Management
ISBN:
9781259666100
Author:
F. Robert Jacobs, Richard B Chase
Publisher:
McGraw-Hill Education
Practical Management Science
Operations Management
ISBN:
9781337406659
Author:
WINSTON, Wayne L.
Publisher:
Cengage,
Operations Management
Operations Management
ISBN:
9781259667473
Author:
William J Stevenson
Publisher:
McGraw-Hill Education
Operations and Supply Chain Management (Mcgraw-hi…
Operations Management
ISBN:
9781259666100
Author:
F. Robert Jacobs, Richard B Chase
Publisher:
McGraw-Hill Education


Purchasing and Supply Chain Management
Operations Management
ISBN:
9781285869681
Author:
Robert M. Monczka, Robert B. Handfield, Larry C. Giunipero, James L. Patterson
Publisher:
Cengage Learning

Production and Operations Analysis, Seventh Editi…
Operations Management
ISBN:
9781478623069
Author:
Steven Nahmias, Tava Lennon Olsen
Publisher:
Waveland Press, Inc.