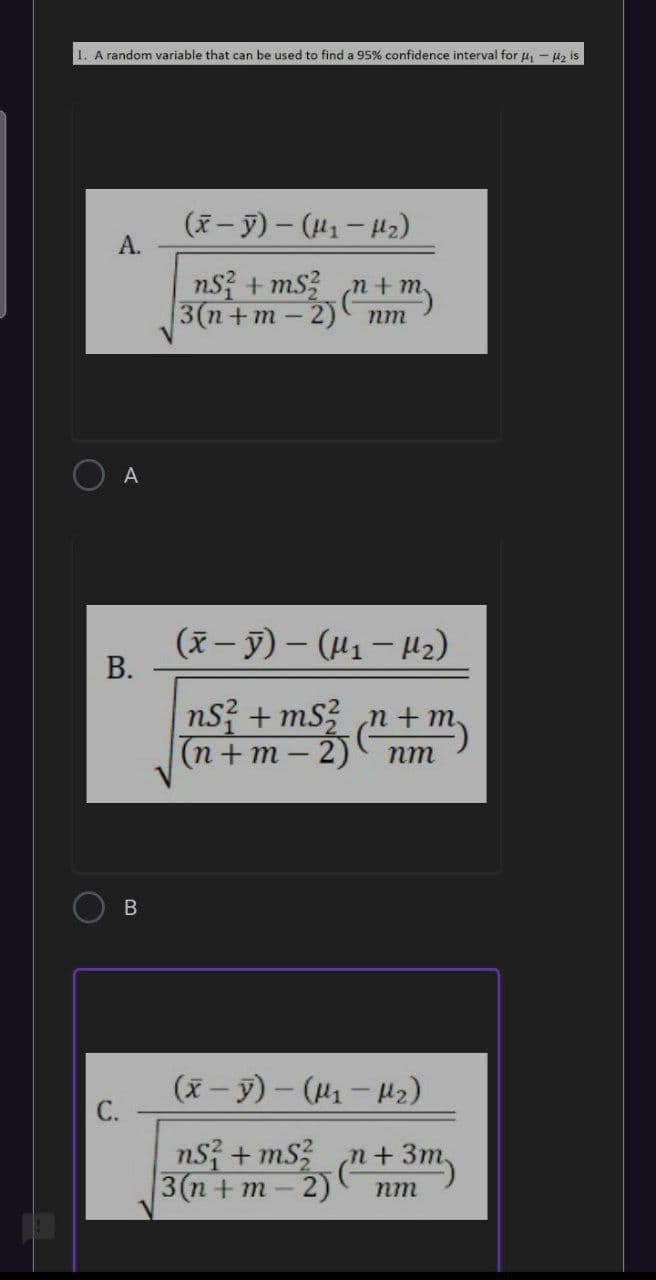
1. A random variable that can be used to find a 95% confidence interval for μ₁-₂ is


Q: Find the area of the shaded region under the standard normal distribution between the given…
A: The standard normal variable is z, which follows the normal distribution with the mean of 0 and…
Q: r other spread if peanut allergy is a concern.) (a.) Lost the steps (elements) required to prepare…
A: As the question contains multiple subparts according to the company guidelines we are supposed to…
Q: Assume that a sample is used to estimate a population proportion μμ. Find the margin of error M.E.…
A: Given,sample size(n)=293sample mean(x¯)=31.3sample standard deviation(s)=15.1degrees of…
Q: Complete the following probability distribution table: Probability Distribution Table X P(X) - 29…
A: From the provided information, x P (X = x) -29 0.4 16 0.1 20 28 0.2…
Q: The effectiveness of a blood-pressure drug is being investigated. An experimenter finds that, on…
A:
Q: Find the area under the standard normal curve to the left of the following z-values. Round the…
A: The standard normal variable is z, which follows the normal distribution with the mean of 0 and…
Q: Q1. A bag contains 10 identical disks, there are 2 blue,5 red and 3 green discs. Two are p out at…
A: Here Definied Events P (B) = Probability of Blue ball P(R) = Probability of Red ball P(G)=…
Q: After the premiere of the new comedy Bumblebee, moviegoers were asked in a quick poll whether they…
A: It is given that, out of 25 adults,16 said they liked the movie, whereas out of 50 teenagers, 39…
Q: Q1) e- The subjects' score of a student at the final exams were as in the following table.…
A:
Q: 8. PROBLEM SOLVING: Solve the following problems and answer the questions that follow 1. Suppose…
A: Combinations is the selection of items or grouping of items in which order of any element does not…
Q: 21. Find the probability value of (Z > -1.00). a. 15.87% b. 34.13% c. 84.13% d. 90.13% 22. Compute…
A:
Q: Use the frequency distribution to the right, which shows the number of voters (in millions)…
A: Required probability is P(age range not between 18 to 20 years old)
Q: Suppose your marketing department feels like 36% of customers prefer a certain feature for a…
A: a) The null hypothesis is: H0: p = 0.36
Q: In a survey, 25 people were asked how much they spent on their child's last birthday gift. The…
A:
Q: Find the area of the shaded region under the standard normal distribution to the right of the given…
A: Given the curve is standard normal distribution Let X~N(μ,σ) μ=Mean σ=Standard deviation Then…
Q: * Q5) A college class contains boys and girls students together. The number of boys in the class is…
A:
Q: Despite the repeated effort by the government to reform how Wall Street pays its executives, some…
A: Given Information: It is known that 10 out of 15 members of the board of directors of a company were…
Q: 15. Which of the following statements is TRUE about the standard deviation of a discrete random…
A: There is a different table given for question 17 to20 and question 21 to 24
Q: Q1) b- for the following data, (19, 32, 26, 71, 88, 45, 59), the Harmonic Mean (H) is 37.4406 O…
A: Given dataset is 19,32,26,71,88,45,59
Q: 20. What is the probability of z value indicated by (Z <-1.78)? d. 0.9633 a. 0.0375 b. 0.3075 c.…
A: According to our guidelines, we can answer only the first question. So, please repost the rest…
Q: You and your spouse are in good health and have reasonably secure jobs. Each of you makes about…
A: Using DINK method One half of the mortgage is $125000/2= $62500 One half of car loan $16100/2=…
Q: A fair coin is tossed 200 times. Find the probability that heads will show 100 times.
A:
Q: Let's suppose you draw random samples of same size from same population and compute 95% confidence…
A: The objective is to define the correct assumption regarding the population mean confidence interval…
Q: Based on the given table below, what is the mode? Table 1. Distribution According to Favorite…
A: Given that,
Q: A random sample of 200 adults was given an IQ test. It was found that 90 of them scored higher than…
A: From the provided information, Sample size (n) = 200 From which 90 have score higher than 100 (IQ).…
Q: I am unable to obtain the same final answer and wonder if I am calculating a portion incorrectly.…
A: It is given that the simplified answer is -6.831.
Q: Determine whether the statement is true or false. If it is false, rewrite it as a true statement. As…
A:
Q: If a z-score is zero, which of the following must be true? Explain your reasoning. The mean is zero.…
A: We have to find true statement for z. As we know z= (x-mean)/sd
Q: For numbers 26-30, refer to the following: A roulette wheel in an amusement park has the numbers 1…
A: Solution Given That A roulette wheel in an amusement park has the numbers 1 through 60 , If you bet…
Q: Question 8 A research firm wants to estimate, within 3 percent, the proportion of junior executives…
A: Question 8: Given Information: Margin of error E=±3% i.e., 0.03 Confidence level is 95% Percent of…
Q: You receive a brochure from a large university. The brochure indicates that the mean class size for…
A: Each hypothesis test used two methods to make conclusions. They are p value approach and critical…
Q: Determine whether the statement is true or false. You toss a coin and roll a die. The event "tossing…
A: You toss a coin and roll a die. The event "tossing tails and rolling a 1 or 3" is a simple event.
Q: a) z> 1.5 b) z <1.5 c) - 1.4<<<0.95
A: Here AS PER POLICY I HAVE CALCULATED FIRST 3 SUBPART PLZ REPOST FOR REMAINING PARTS WITH NOTE I NEED…
Q: III. PROBLEM SOLVING: Solve for the t or z value of the following. Write your answer to the nearest…
A:
Q: Three bags of the same appearance have the following proportion of balls: 2 black and 1 white in…
A: Probability is just how likely something is to happen. Whenever we're unsure about the end result of…
Q: Suppose a mutual fund qualifies as having moderate risk if the standard deviation of its monthly…
A: Chi square test are used to test the population variance. It determine the relationship between the…
Q: Test the given claim. Identify the null hypothesis, alternative hypothesis, test statistic, P-value,…
A:
Q: * Q3) b- In an advertising award, there are 97 losers out of each 100 cards. If a person purchases…
A: It is interpreted that: Total no. of cards=100. Total no. of cards that are losers=97.
Q: Below are two distributions. Select the correct sign (>, <, =) for the statements below. Mean of…
A: Given: n1 = 50 n2 = 50 Formula used: Mean X = ∑i=1nXin Mode = The value that appears most…
Q: 70% of all bald eagles survive their first year of life. Give your answers as decimals, not…
A:
Q: k Q1) c- The probability of twice withdraw the same ball from a box contains 25 balls, 5 balls are…
A: Total no: of balls=25 White balls=5 blue balls=7 black balls=9 no: of ways =
Q: Determine whether the claim stated below represents the null hypothesis or the alternative…
A:
Q: A study was conducted to test the effectiveness of a juggling class. Before the class started, six…
A: The t test is a type of parametric test. It used to compare the mean significance between the sample…
Q: Explain the difference between the z-test for μ using rejection region(s) and the z-test for μ using…
A:
Q: On a planet far far away from Earth, IQ of the ruling species is normally distributed with a mean of…
A: Since you have posted a question with multiple sub-parts, we will solve first 3 sub-parts for you.…
Q: Google it: According to a recent report, 66% of Internet searches in a particular month used the…
A: According to guidelines we solve first three subparts when given multiple subparts.
Q: Directions: Follow the steps in testing the hypothesis to answer the following problems. a. Identify…
A: a) The hypothesized proportion is 0.20.
Q: Determine the required value of the missing probability to make the distribution a discrete…
A: given; probability distribution P(x) of discrete random variable x :- x P(x) 3 0.31 4 ? 5…
Q: e want to conduct a hypothesis test of the claim that for middle-aged adults the population's mean…
A: a) The population standard deviation is 19.2 and it is known.
Q: Q2) The following data represents the results of an experimental test, if the relation between…
A: The given data is: .

Step by step
Solved in 3 steps

- A random sample of size 32 is selected from population X, and a random sample of size 43 is selected from population Y. A 90 percent confidence interval to estimate the difference in means is given as (−1.25,0.87). Consider a change in the sample sizes such that a random sample of size 52 is selected from population X and a random sample of size 63 is selected from population Y. When all other things remain the same, what effect would such a change have on the interval?A random sample of size 32 is selected from population X, and a random sample of size 43 is selected from population Y. A 90 percent confidence interval to estimate the difference in means is given as (−1.25,0.87)(−1.25,0.87). Consider a change in the sample sizes such that a random sample of size 52 is selected from population X and a random sample of size 63 is selected from population Y. When all other things remain the same, what effect would such a change have on the interval? A) The width of the interval will increase. B) The width of the interval will decrease. C) The interval will contain no negative numbers. D) The level of confidence will increase. E) The sample means will increase.Suppose that three random variables X1, X2, X3 form a random sample from the uniform distribution on interval [0, 1]. Determine the value of E[(X1-2X2+X3)2]
- A poisson random variables has f(x,3)= 3x e-3÷x! ,x= 0,1.......,∞. find the probabilities for X=0 1 2 3 4 and also find mean and variance from f(x,3).?2) Find the t-values that form the boundaries of the critical region for a two-tailed test with alpha of .05 for for n = 15A sample of 20 elements selected from a population produced a mean of 65 and a standard deviation of 9. Another sample of 25 elements selected from another population produced a mean of 58 and a standard deviation of 11. Assume that the two populations are normally distributed and the standard deviations of the two populations are equal. The null hypothesis is that the means of the two populations are equal and the alternative hypothesis is that the means of the two populations are not equal. The significance level is 5%. The critical values of t are: a. –2.014 and 2.014 b. –2.017 and 2.017 c. –1.681 and 1.681 d. –1.679 and 1.679
- Consider a hypothesis test with H 0: μ = 20 vs H 1: μ ≠ 20) at α = 0.05 on mean of a Normal population with unknown variance. If the sample variance is 4 and the true mean is 18.5, then the sample size required to obtain a power of test at least 80% is close to 15 using an appropriate OC curve. True FalseSuppose X is a random variable with standard beta distribution and parameters (alpha) = 8 and (beta) = 2 What is (PX>=0.6)?1.Random sample of size 36 were drawn with replacement from a popolation with mean and variance 0.9, and in each case the sample mean was calculated. Find the variance of X. 2.Random sample of size 9 were drawn with replacement from a popolation with mean and variance 4.2, and in each case the sample mean was calculated. Find the variance of X. 3. Random samples of size 10 are drawn with replacement from a population with mean 4 and variance 6. Let X be the sample mean. Find E(X) and Variance(X).
- We plan to run a two-tailed t-test. Our sample size is 8, and we've decided upon an alpha level of 0.01. From the t-table, what is the t critical value(s)?1. The sample mean weights for two varieties of lettuce grown for 16 days in a controlled environment are 3.259 and 1.413 and the corresponding sample standard deviations are .400 and .220. If the sample sizes for the two varieties are 9 and 6 respectively, what would be the pair of hypotheses to test if the two varieties of lettuce have the same average weight? (Given: weight of each variety of lettuce is normally distributed). A. H0: μ1 ≠ μ2 vs H1: μ1 = μ2 B. H0: μ1 = μ2 vs H1: μ1 ≠ μ2 C. H0: μ1 > μ2 vs H1: μ1 ≤ μ2 D. H0: μ1 ≤ μ2 vs H1: μ1 > μ2 2. At 5% level, what are the critical values for testing equality of mean weights in problem 1? A. 2.18 B. -2.18 and 2.18 C. -1.78 D.-1.78 and 1.78 3.What is the best decision using critical value approach in problem 1? A. The computed test statistic falls in the critical region and we do not reject the null hypothesis. B. The computed test statistic does not fall in the critical…1. The sample mean weights for two varieties of lettuce grown for 16 days in a controlled environment are 3.259 and 1.413 and the corresponding sample standard deviations are .400 and .220. If the sample sizes for the two varieties are 9 and 6 respectively, what would be the pair of hypotheses to test if the two varieties of lettuce have the same average weight? (Given: weight of each variety of lettuce is normally distributed). A. H0: μ1 ≠ μ2 vs H1: μ1 = μ2 B. H0: μ1 = μ2 vs H1: μ1 ≠ μ2 C. H0: μ1 > μ2 vs H1: μ1 ≤ μ2 D. H0: μ1 ≤ μ2 vs H1: μ1 > μ2 2.What would be the degree of freedom for the test statistic in problem 1? A. 6 B. 9 C. 12.7 D. 14 3. What would be the computed test statistic in problem 1? A. 2.93 B. 3.57 C. 8.44 D. 11.48


