1. A sample of 50 listeners of Light and Easy radio station was taken and the data on their ages was organised into a frequency distribution. Number of listeners Age 13-20 4 21-28 8 29-36 10 37-44 12 45-52 9 53 - 60 7 a. Construct a frequency table with columns for class midpoint, frequency, relative frequency, cumulative frequency, and cumulative relative frequency. b. Draw a histogram for the above distribution. C. Based on the table above, calculate the following: i. Minimum ii. Maximum iii. Mode iv. Mean V. Median vi. First Quartile vii. Third Quartile viii. Interquartile Range ix. Amplitude X. Mean Absolute Deviation
1. A sample of 50 listeners of Light and Easy radio station was taken and the data on their ages was organised into a frequency distribution. Number of listeners Age 13-20 4 21-28 8 29-36 10 37-44 12 45-52 9 53 - 60 7 a. Construct a frequency table with columns for class midpoint, frequency, relative frequency, cumulative frequency, and cumulative relative frequency. b. Draw a histogram for the above distribution. C. Based on the table above, calculate the following: i. Minimum ii. Maximum iii. Mode iv. Mean V. Median vi. First Quartile vii. Third Quartile viii. Interquartile Range ix. Amplitude X. Mean Absolute Deviation

Glencoe Algebra 1, Student Edition, 9780079039897, 0079039898, 2018
18th Edition
ISBN:9780079039897
Author:Carter
Publisher:Carter
Chapter10: Statistics
Section10.6: Summarizing Categorical Data
Problem 23PPS

Related questions
Question
statistic question,
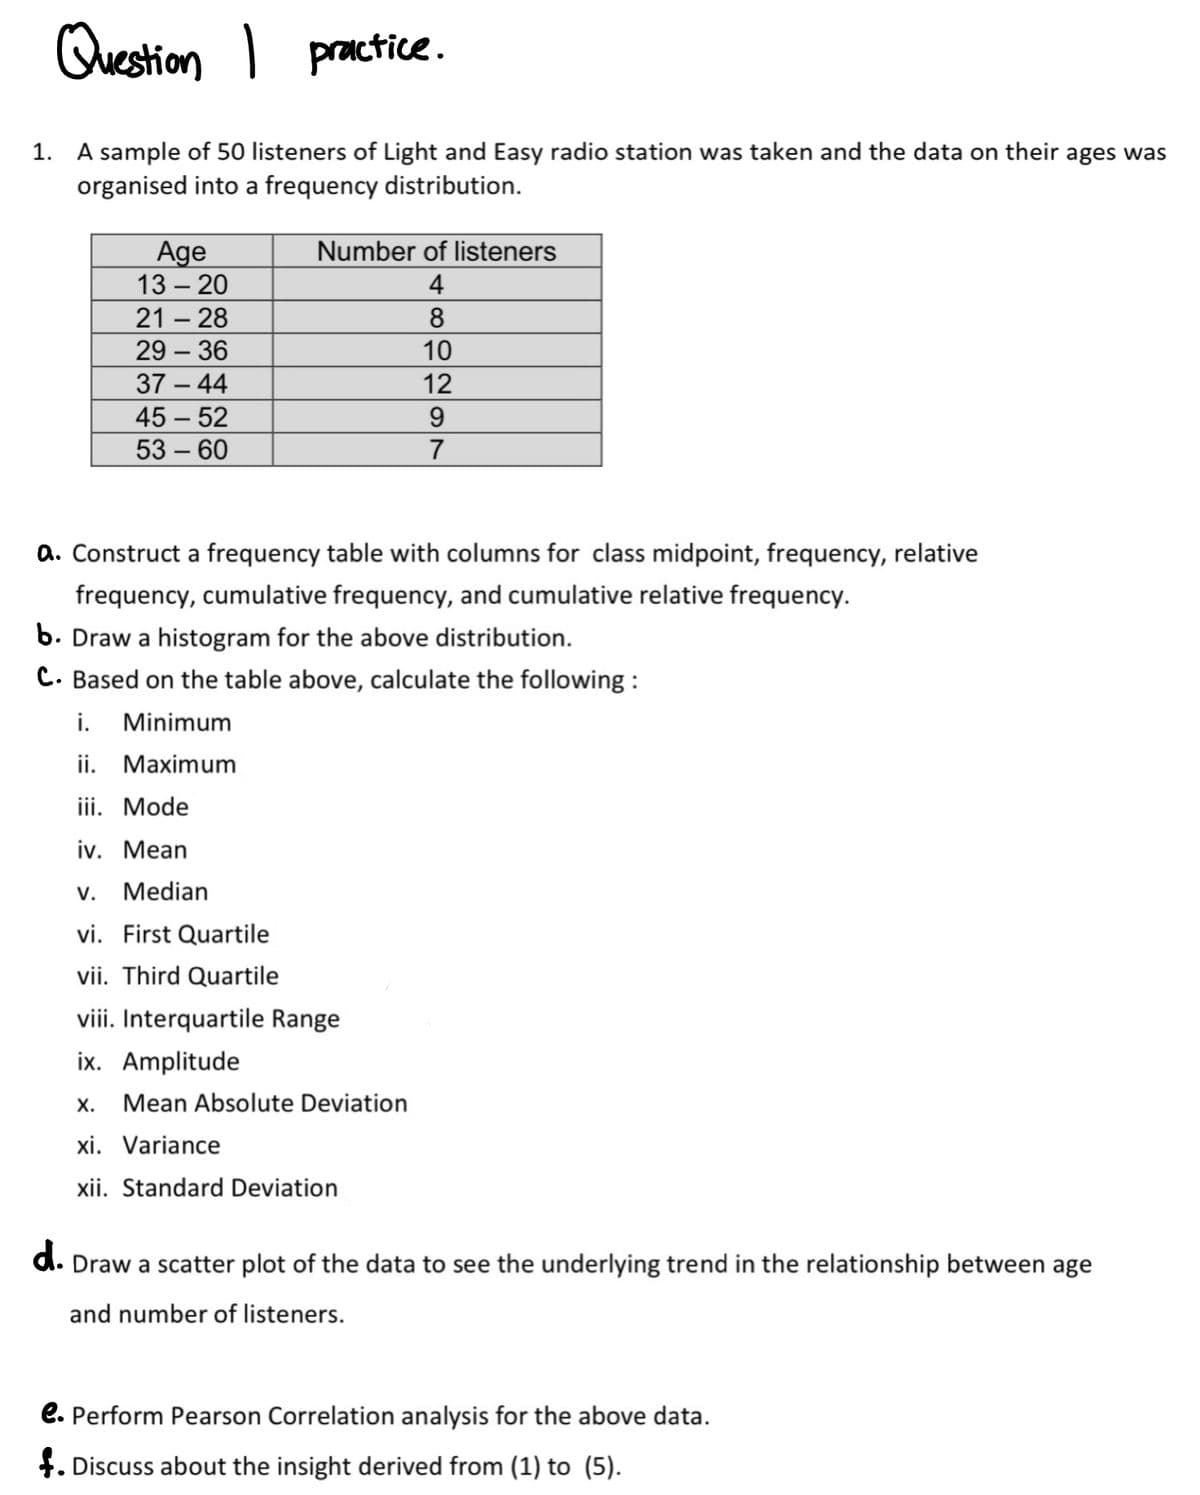
Transcribed Image Text:Question I practice.
1. A sample of 50 listeners of Light and Easy radio station was taken and the data on their ages was
organised into a frequency distribution.
Number of listeners
Age
13 - 20
4
21-28
8
29 - 36
10
37-44
12
45-52
9
53-60
7
a. Construct a frequency table with columns for class midpoint, frequency, relative
frequency, cumulative frequency, and cumulative relative frequency.
b. Draw a histogram for the above distribution.
C. Based on the table above, calculate the following:
i. Minimum
ii. Maximum
iii. Mode
iv. Mean
V. Median
vi. First Quartile
vii. Third Quartile
viii. Interquartile Range
ix. Amplitude
X. Mean Absolute Deviation
xi. Variance
xii. Standard Deviation
d. Draw a scatter plot of the data to see the underlying trend in the relationship between age
and number of listeners.
e. Perform Pearson Correlation analysis for the above data.
f. Discuss about the insight derived from (1) to (5).
Expert Solution
This question has been solved!
Explore an expertly crafted, step-by-step solution for a thorough understanding of key concepts.

This is a popular solution!

Trending now
This is a popular solution!

Step by step
Solved in 4 steps with 3 images

Recommended textbooks for you
Glencoe Algebra 1, Student Edition, 9780079039897…
Algebra
ISBN:
9780079039897
Author:
Carter
Publisher:
McGraw Hill

Big Ideas Math A Bridge To Success Algebra 1: Stu…
Algebra
ISBN:
9781680331141
Author:
HOUGHTON MIFFLIN HARCOURT
Publisher:
Houghton Mifflin Harcourt

Holt Mcdougal Larson Pre-algebra: Student Edition…
Algebra
ISBN:
9780547587776
Author:
HOLT MCDOUGAL
Publisher:
HOLT MCDOUGAL
Glencoe Algebra 1, Student Edition, 9780079039897…
Algebra
ISBN:
9780079039897
Author:
Carter
Publisher:
McGraw Hill
Big Ideas Math A Bridge To Success Algebra 1: Stu…
Algebra
ISBN:
9781680331141
Author:
HOUGHTON MIFFLIN HARCOURT
Publisher:
Houghton Mifflin Harcourt
Holt Mcdougal Larson Pre-algebra: Student Edition…
Algebra
ISBN:
9780547587776
Author:
HOLT MCDOUGAL
Publisher:
HOLT MCDOUGAL