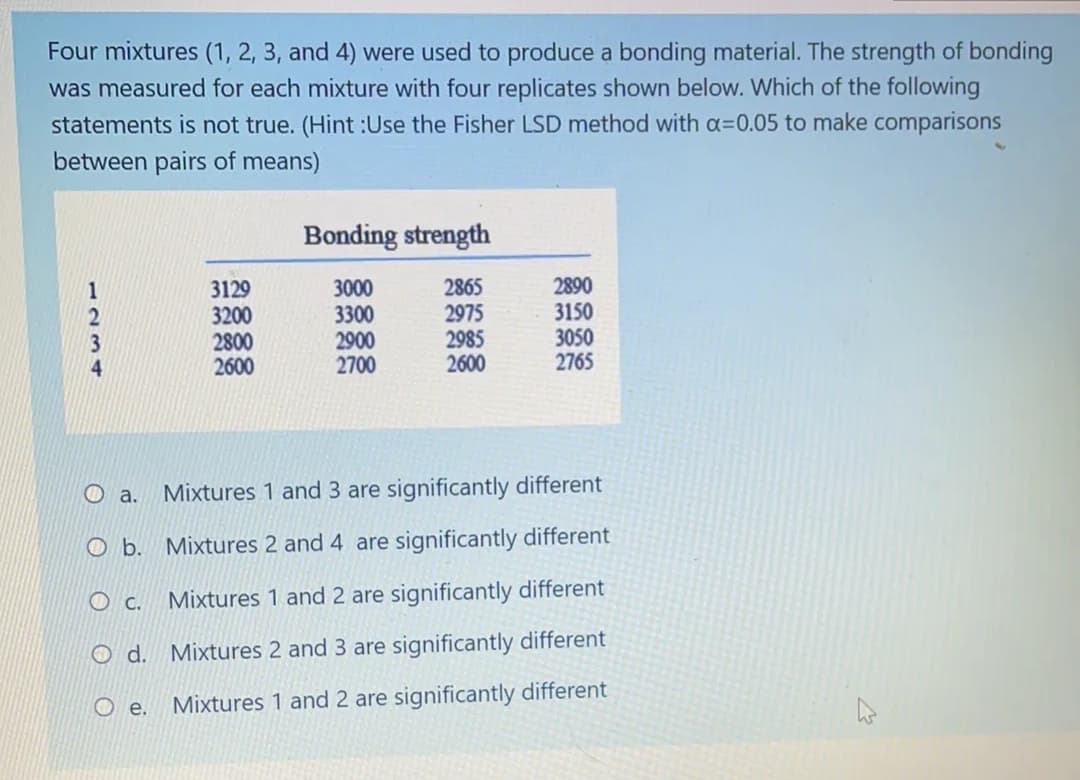
Four mixtures (1, 2, 3, and 4) were used to produce a bonding material. The strength of bonding was measured for each mixture with four replicates shown below. Which of the following statements is not true. (Hint :Use the Fisher LSD method with a=0.05 to make comparisons between pairs of means)
Q: A sample of n = 6 scores has a mean of M = 10. One score in sample is changed from X = 12 to X = 0.…
A: Given that, n = 6 mean of M = 10
Q: the sample size required to limit the margin of error to within 0.031 of the population proportion…
A: Given : Margin of error: ME = 0.031
Q: Column A 1. Population Mean Symbol 2. Population Variance formula 3. Standard Deviation of Ungrouped…
A: from the given data
Q: The dice is thrown 180 times, the probability that the number 6 appears from 40 to 45 is 0.1359,…
A: Given that ; Sample size ( n) = 180 Probability of 6 is appear (p) = 1/ 6 By using binomial…
Q: The members of a consulting firm rent cars from three rental agencies: 20% from Agency A, 50% from…
A: Probability is the chance of occurrence of an event.
Q: A power company is installing utility poles that are supposed to have a height of 40 feet. The…
A: Use the Excel and calculate the Sample Mean and Sample Standard deviation
Q: 2) Two boxes A and B A contains 2 red balls and 6 white balls and B contains 2 red and 1 white ball.…
A: Box A:no.of red balls=2no.of white balls=6Total no.of balls=8Box B:no.of red balls=2no.of white…
Q: For each of the following variables, determine whether the variable is categorical or numerical. If…
A: The objective is to find whether the variable is discrete or categorical.
Q: Based on the data shown below, calculate the regression line (each value to at least two decimal…
A: 23.
Q: es No Total New England 27 13 Mid-Atlantic 29 11 Midwest 28 12 Great plains 33 7 South Atlantic 32 8…
A: Given information: Yes No Total New England 17 13 40 Mid Atlantic 29 11 40 Midwest 28 12…
Q: When tossing 4 coins, if A event represents the appearance of at most 3 pictures, then A is : {HHHH)…
A: 4 coins tosses. Outcome will be 1 coin =2 possible outcomes 4 coins = 2^4 = 16 outcomes. Probability…
Q: Suppose salaries at a very large corporation have a mean of PKR 100,000/= and a population standard…
A: From the provided information, Mean (µ) = 100000 Population standard deviation (σ) = 20000 X~N…
Q: For the past ten years, the daily high temperature on January 1 in a mountain town (in degrees…
A: Given data: For the past ten years, the daily high temperature on January 1 in a mountain town (in…
Q: An article contains 1303 words. The frequencies of words with various lengths are given in the…
A: The question is about probability Given :
Q: 2.P(Z0)= 4.P(Z>-2.11)= 5.P(Z> 1.62)=_ 6 P(Z> 2.36)=
A:
Q: A metal detector tries to distinguish between a person who is carrying a weapon or bomb from those…
A: Given: It is given that Null hypothesis: H0 : "The person is not carrying a weapon" Alternative…
Q: a. Compute the seasonal index for Spring: b. Compute the seasonal index for Summer: c. Compute the…
A: It is given that M1 = Mean(spring) = 4000 M2 = Mean(summer) = 3000 M3 = Mean(fall) = 2000 M4 =…
Q: Question 20: A regression was run to determine if there is a relationship between hours of TV…
A: To predict: The number of situps a person who watches 6 hours of TV can do.
Q: ects several samples from the manufacturer and records the following learned in Forecasting,…
A: Given: The data given is as shown below Temperature (x) Strength (y) 185 5150 183 5125 187…
Q: Estimate the minimum sample size needed to achieve the margin of error E=0.032 for a 95% confidence…
A:
Q: Two boxes A and B contain 1. 2 red balls and 6 white balls, and B contains 2 red and 1 white ball.…
A: given 0.458 is the answer please check the below attachment
Q: Assume the two population variances are equal. i. Test at the 1% level of significance that the…
A: Followings are the Explanation of the question Hypothesized Population Mean (µ) = 9 gm/L The…
Q: Which of the following is NOT true about correlation? a. Used to make predicitons for dependent…
A: It is needed to discuss about the correlation.
Q: An automatic filling machine is used to fill bottles with liquid detergent. A random sample of 20…
A: Given C=0.95 S^2=0.0153 n=20
Q: An advertising agency collected a random sample of 300 businesses targeted with an advertising…
A:
Q: n uses simple exponential smoothing with trend adjustment to forecast dema 0.4" and "=0.3". The…
A:
Q: Is there a relationship between one’s gender and whether one owns a dog, cat, or reptile? Use the…
A: It needed to test whether there is a relationship between one’s gender and whether one owns a dog,…
Q: The Energy Star rating system is an energy efficiency program run by the U.S. Environmental…
A: Given data…
Q: What is the expected average height of 8 year old boys, using the regression equation?
A: From the given information, the obtained regression equation is y=27.84+2.573x.
Q: After constructing any relative frequency distribution, what should be the sum of the relative…
A: We know that Relative frequency : It is the ratio of frequency of that class to the sum of…
Q: A die is loaded in such a way that the probability of the face with j dots turning up is…
A: Given A die is loaded in such a way that the probability of the face with j dots turning up is…
Q: estion 24: A regression was run to determine if there is a relationship between hours of TV watched…
A: Given data, The regression equation is y=ax+b y=-1.144x+35.462 If x=9 y=?
Q: he highway fuel economy of a 2016 Lexus RX 350 FWD 6-cylinder 3.5-L automatic 5-speed using premium…
A: We have given that μ = 26.00 σ = 2.5 n = 16
Q: According to a study, the proportion of people who are satisfied with the way things are going their…
A: From the provided information, Population proportion (p) = 0.78 Sample size (n) = 100
Q: Identify which of the variables is most likely to be the explanatory variable, and which is most…
A: “Since you have posted a question with multiple sub-parts, we will solve first three sub-parts for…
Q: 4. A fisherman catches 200 fish to sell. He measures the lengths, I cm of these fish, and the…
A: Given: A fisherman catches 200 fish to sell. He measures the lengths, l cm of these fish.
Q: Below is the frequency distribution of the recorded weights in kilograms of the Grade 7 students at…
A: We have given that, Class interval frequency (f) 44 - 46 4 41 - 43 13 38 - 40 16 35 -…
Q: H. Find the expected value of Z = (X2 + y2)₂. Let X and Y be random variables with joint density…
A: X and Y are random variables with joint density function given by fx,y=4xy 0<x,y<1
Q: a) The probability that a score is from 185 to 210 is 1 (Round to four decimal places as needed.) b)…
A: as per our company guidelines we are able to answer only first 3 sub-parts. Kindly repost other…
Q: Let x be a random variable with a mass probability function given in the following table: 1 0 -1 X…
A: Solution-: We have following table: X P(X) 1 1/2 0 1/3 -1 k We want to check…
Q: . Length of hair of female students. _______2. The number of children with decayed teeth in Barangay…
A: Discrete Variable: The variable in which value is countable and finite. Example {1,2,3,4,6}…
Q: 1.P(Z0)=
A: We will use Standard Normal table to find the required probabilities.
Q: estion 20: Based on the data shown below, calculate the correlation coefficient (rounded to three…
A: Given data, X Y X*Y X*X Y*Y 1 9.41 9.41 1 88.5481 2 9.62 19.24 4 92.5444 3 10.13 30.39 9…
Q: The uniform distribution of a random variable X is given in the figure below. 0 2 1. X From the…
A:
Q: Question 14: Here is a bivariate data set in which you believe y to be the response variable. x y…
A: Solution Given data is
Q: The following represent the weight of units produced in a production line (6822 5333 7420 7432 6252…
A: given data : 6822,5333,7420,7432,6252,7005,6752 from the above given data sample…
Q: A television program called “Cook-off” changes three of its presenters. The program was viewed by…
A: Given data: Significance level = 5 % Claim: At the 5% SIGNIFICANCE level to determine whether there…
Q: 7) إذا كان( ,4)x~b فأن ((P(x( < E(x هو : ب) 0.5123 0.2531 (¹ 0.1532 ( 0.3125 (
A: Given;x~b(4,12) i.e. x has binomial distribution.where n=4 and p=12find P(x<E(x))=?
Q: For any value of a, we have: ta/2,00 = Za/2 True O False
A: Solution-: For any value of α we have, tα/2,∞=Zα/2 True or false
Q: Question 7: You wish to test the following claim (HaHa) at a significance level of α=0.10α=0.10.…
A:
Step by step
Solved in 3 steps with 3 images
- A student decides to spin a dime and determine the proportion of times it lands on heads. The student spins the dime 25 times and records that it lands on heads 17 times. Let p = the true proportion of times the dime would land on heads when spun. Under the assumption that the true proportion is 0.5, 100 simulated proportions for samples of size 25 is shown in the dotplot. Using the dotplot, is there evidence that the proportion of times a spun dime lands on heads is greater than 0.5? A) Yes, a proportion of 0.68 proves that the true proportion of heads is greater than 0.5. B) Yes, a proportion of 0.68 only occurred once out of 100 simulated proportions; therefore, there is sufficient evidence that the true proportion of heads is greater than 0.5. C) No, a proportion of 0.68 is only 0.18 more than 0.5; therefore, there is insufficient evidence that the true proportion of heads is greater than 0.5. D) No, a proportion of 0.68 or more occurred 7 times out of 100 simulated…A recent poll found that 664 out of 1026 randomly selected people in a particular country felt that colleges and universities with big sports programs placed too much emphasis on athletics over academics. Assuming the conditions for the CLT are met, use the accompanying Minitab output to complete parts a and b below. N Event Sample p 95% CI for p 1026 664 0.647173 (0.617934, 0.676413) Question content area bottom b. Suppose a sports blogger wrote an article claiming that a majority of adults from this country believe that colleges and universities with big sports programs place too much emphasis on athletics over academics. Does this confidence interval support the blogger's claim? Explain your reasoning. A. No, it is not a plausible claim because the confidence interval contains 50%. B. No, it is not a plausible claim because the confidence interval does not contain only values above 50%. C. Yes, it is a…Silicon chip manufacturers require the use of so-called "clean rooms" in which the air is filtered in a special way to keep the number of dust particles to a minimum. Five air samples were taken in each room and the dust level was measured on a scale of 1 (low) to 10 (high). Room 1 Room 2 Room 3 5 3 1 6.5 6 1.5 4 4 3 7 4.5 2.5 6 3 4 Use the Tukey-Kramer test to make all pairwise comparisons of clean rooms.
- A small college has been accused of gender bias in its admissions to graduate programs.a. Out of 500 men who applied, 255 were accepted. Out of 700 women whoapplied, 240 were accepted. Find the acceptance rate for each gender. Does thissuggest bias?b. The college then looked at each of the two departments with graduate programsand found the data below. Compute the acceptance rate within each departmentby gender. Does this suggest bias? c. Looking at our results from Parts A and b, what can you conclude? Is theregender bias in this college’s admissions? If so, in which direction?When the parameter and the sample size is equal to the parameter is being estimated, then the estimator is said to be _________________. a. Unbiased b. Consistent c. Regular d. EfficientThe number of contaminating particles on a silicon waferprior to a certain rinsing process was determined for eachwafer in a sample of size 100, resulting in the followingfrequencies:Number of particles 0 1 2 3 4 5 6 7Frequency 1 2 3 12 11 15 18 10Number of particles 8 9 10 11 12 13 14Frequency 12 4 5 3 1 2 1a. What proportion of the sampled wafers had at leastone particle? At least five particles?b. What proportion of the sampled wafers had betweenfive and ten particles, inclusive? Strictly between fiveand ten particles?c. Draw a histogram using relative frequency on thevertical axis. How would you describe the shape of thehistogram?
- Determine if assumptions have been violated and if a between-subjects, one-way ANOVA can be completed: A biomedical engineer compared the abrasion resistance — as measured by number of rotations until failure — of three different artificial hips. Manufacturer X makes hip joints out of metal, manufacturer Y out of ceramic, and manufacturer Z out of a metal/ceramic composite. The biomedical engineer gets a random sample of 6 hips from each manufacturer’s production line and tests each one individually until failure occurs.In a breeding experiment, chicken with white feathers, small comb were mated and the offspring categories white feathers, small comb (WS), white feathers. large comb (WL), dark feathers, small comb (DS) and dark feathers, large comb (DL) were expected to follow the ratio 9:3:3:1 the researcher observed that there were 100 WS, 32 WL, 40 DS and 20 DL offspring. In order to test if the observed frequencies follow the expected ratio, what should be the hull hypothesis?A. P(WS) = 100/192, P(WL) = 32/192, P(DS) = 40/192 , P(DL) = 20/192 B. P(WS) = 100 , P(WL) = 32, P(DS) = 40, P(DL) = 20 C. P(WS) = 9/16 , P(WL) = 3/16, P(DS) = 3/16, P(DL) = 1/16 D. P(WS) = 9, P(WL) = 3, P(DS) = 3 , P(DL) = 1 2. In Problem 1, what would be the degree of freedom for an appropriate test?A.2 B.3 C.4 D.1 3. What is the value of the computed test statistic in problem 1? A.7.81 B.3.84 C.6.81 D.5.99 5.What would be the p-value for this test in problem 1? A.0.28 B.0.05 C.0.08 D. 0.11 6. At 5-% level of significance,…A consumer group is investigating a producer of diet meals to examine if its prepackaged meals actually contain the advertised 6 ounces of protein in each package. Based on the following data, is there any evidence that the meals do not contain the advertised amount of protein? Run the appropriate test at a 5% level of
- A sample of 12 male and 12 female students were surveyed and the amount spent on food last week were recorded. The results are summarized in the table below. Test for the hypothesis that the weekly amount spent on food of male and female students is the same, at a=0.10. Male Female 623 685 537 629 613 517 588 580 651 658 688 582 526 614 579 528 814 655 878 804 660 549 722 617 a. What are the null and alternative hypotheses?b. What is the critical value? (4 decimal points)c. What is the test statistic? (4 decimal points)e. Reject or accept null hypothesis?The dataset TrafficFlow gives the delay time in seconds for 24 simulation runs in Dresden, Germany, comparing the current timed traffic light system on each run to a proposed flexible traffic light system in which lights communicate traffic flow information to neighboring lights. On average, public transportation was delayed 105 seconds under the timed system and 44 seconds under the flexible system. Since this is a matched pairs experiment, we are interested in the difference in times between the two methods for each of the n=24 simulations. For the differences D, we were given that seconds with seconds. We wish to estimate the average time savings for public transportation on this stretch of road if the city of Dresden moves to the new system.The standard error is 3.1 for one set of 10,000 bootstrap samples. Find a confidence interval for the average time savings.Round your answers to one decimal place.31% of all pygmy softshell toises have stripes on their shells. A herpetologist in Cititon collects a sample of 28 pygmy softshell tortoises and finds that 8 of them have stripes on their shells. Is there enough evidence to conclude, at a significance of alpha=0.05, that the proportion of pygmy softshell tortoises in Cititon with stripes on their shells is less than 31%? What is the claim? What is the null hypothesis? What is the alternative hypothesis? What is the test statistic? What is/are the critical value(s)? Do we reject the null hypothesis? What conclusion do we draw? What is the P-value for the problem above?