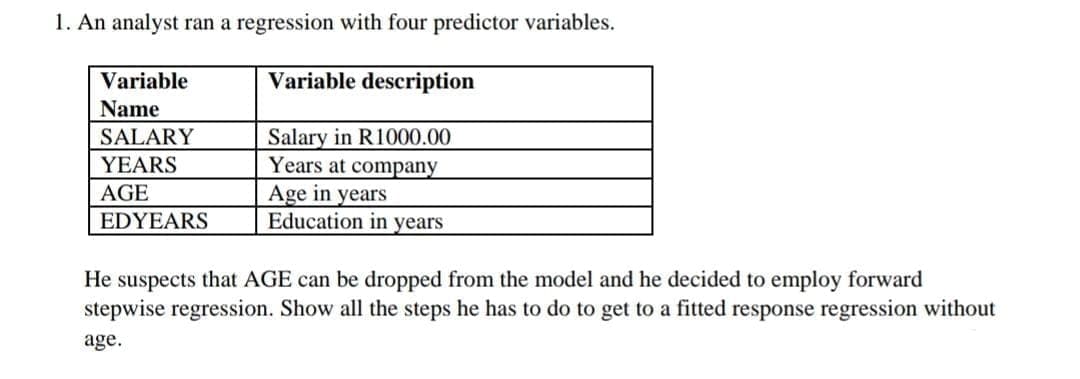
1. An analyst ran a regression with four predictor variables. Variable description Salary in R1000.00 Years at company Variable Name SALARY YEARS AGE EDYEARS Age in years Education in years


Q: Is there a significant difference on the ratings of the respondents on X15 when grouped according to…
A: Given: Null Hypothesis: There is no significant difference on New Product – X15 when grouped…
Q: Assume that x has a normal distribution with the specified mean and standard deviation. Find the…
A: Suppose the variable of interest is x.
Q: baseball, a player’s batting average is the proportion of times the player gets a hit out of the…
A:
Q: Use the sample information x¯x¯ = 40, σ = 4, n = 20 to calculate the following confidence intervals…
A: Given Sample mean x̄=40, n=20, population standard deviations σ=4
Q: Find out some merits and demerits of seasonal variation? Find out some merits and demerits of…
A: Since you have asked multiple questions, we will solve the first question for you. If you want any…
Q: Go to artofstat.com, click on WebApps and open the Sampling Distribution for the Sample Mean for…
A: Given , that the Sampling Distribution for the Sample Mean for continuous variables graph.
Q: Miguel is judging an essay contest. He has to select the best, second best, and third best. If there…
A: There are 24 essays entered.
Q: Consider purchasing a system of audio components consisting of a receiver, a pair of speakers, and a…
A: Since you have posted a question with multiple sub-parts, we will solve first three subparts for…
Q: 12. Meaning of the Dow The Dow Jones Industrial Average (DJIA) is a commonly used index of the…
A: From the provided information, Mean (µ) = 13.59 Standard deviation (σ) = 94.05
Q: How do you calculate ophat? 0% b/f P(1-P) 12 OP(1-P) √n Ophat-(1-phat) √n phat-(1-phat) TL
A:
Q: Dolling is a popular technique used to determine the outcome of an election prior to results being…
A: Given that Population proportion p=0.51 Sample size n =400
Q: 16. Question: Brenda wants to estimate the percentage of people who eat fast food at least once per…
A: As per the Bartleby guildlines we have to solve first question and rest can be reposted... Given…
Q: Scores for men on the verbal portion of the SAT-I test are normally distributed with a mean of 509…
A: Given that. X~N( μ , ?^2 ) μ=509 , ?=112 Z-score =( x - μ )/?
Q: Does training in a memory program affect memory for spontaneously observed events? A researcher…
A:
Q: Before you begin you will need to consider the possible causes of death and design an experiment for…
A: A hypothesis is any statement which may be rejected based on a certain set of evidences. The…
Q: Test the given claim. Assume that a simple random sample is selected from a normally distributed…
A: The question is about hypo. testing Given : Data : -44, 75, -21, -72, -45, 10, 18, 53, -8, -52,…
Q: 2. Suppose that X₁,..., Xn form a random sample from a Exponential (A) distribution, with PDF given…
A: Given the pdf:- f(x)= λe-λx , x>0 , λ>0
Q: Q1. Consider the following options for characters in setting a password: Digits = { 0, 1, 2, 3, 4,…
A: Given that Consider the following options for characters in setting a password: Digits = { 0, 1,…
Q: The Coca-Cola Company reported that the mean per capita annual sales of its beverages in the United…
A: Given,sample size(n)=36sample mean(x¯)=460.4sample standard deviation(s)=101.9population…
Q: need help with question one part a and b
A: The given dot plot shows the number of wins for each of the 30 major League Baseball teams in the…
Q: Thirty-five rose bushes are available from a nursery containing 16 red bushes, 11 yellow bushes, and…
A:
Q: Thirty percent of all telephones of a certain type are submitted for service while under warranty.…
A: Givenpercentage of telephones are submitted for service =30%percentage of telephones can replaced…
Q: How long it takes paint to dry can have an impact on the production capacity of a business. An auto…
A: Testing of Hypothesis: H0: μ1=μ2=μ3=μ4 H1: Not all the population means are equal.
Q: The benthic invertebrate data collected from a wetland national wildlife refuge provides the rough…
A: The expected proportions of pre-restoration and observed numbers of post restoration are given.
Q: Explain with all necessary mathematical details as how would you determine the risk-neutral…
A:
Q: A health food store currently has 100 pounds of almonds in stock, which it sells to customers in…
A: The information provided in the question are as follows : Let a random variable X be the number of…
Q: (A) How many females are of age 16-19 and earn minimum wage? (B) How many males are of age 16-24 and…
A: It is given that the data in tabulated form that represents the number of workers per age group (…
Q: Find the z-score for which 69% of the distribution's area lies between -z and z. -1.0152, 1.0152…
A: Z be a standard normal random variable. then z ~ N(0,1)
Q: Both data sets have a mean of 175. One has a standard deviation of 16, and the other has a standard…
A: The stem-and-leaf plots are given and the one has a standard deviation of 16 and other has a…
Q: A schoolteacher is concerned that her students watch more TV than the average American child. She…
A: According to (AAP), the average American child in the population watches 4 hours of TV per day Claim…
Q: In a large set of measurements on nonpregnant women, the average fasting blood glucose level was…
A: Consider X as the fasting blood sugar level for women during the third trimester of pregnancy with μ…
Q: 20. Question: Suppose scores of a standardized test are normally distributed and have a known…
A: Since you have asked multiple question, we will solve the first question for you. If you want any…
Q: Polychlorinated biphenyls (PCBs) are a group of synthetic oil-like chemicals that were at one time…
A: Given that Sample size =60 Sample mean =1.96 Population standard deviation =0.36 At 95% confidence…
Q: Create Compute 1 Grouped Frequency Distribution Table for the three sections. 1 Mean for Grouped…
A: Hi there! Thanks for posting the question. Since there are multiple subparts in computations we will…
Q: O. 0₁6660 = 0.5734 P(Aor B)= 0.57 10) Suppose now that events A and B are independent events with…
A: It is given that the events A and B are independent. P( B ) = 0.27 P( A/B ) = 0.26
Q: This assignment will assess your ability to calculate the mean, median, mode, variance, and standard…
A: Given data…
Q: 6. In a study a number of plants received a dose of a new plant nutrition. A week later, each plant…
A:
Q: 4. If a straight line represents a correlation coefficient of 1 and a complete random pattern…
A: Formula: if the scatter plot upward then it's called position correlation and if the scatter plot…
Q: olaris Pte Ltd is a manufacturer of solar panels used by many organisations in solar farms to…
A: The sales forecast for the 2022 Q3 to 2023 Q2 is computed by using linear regression method.Let y =…
Q: Suppose that a certain car has the following average operating and ownership costs. Average Costs…
A:
Q: what should you put for the output range?
A: Solution: The procedure of performing the one way ANOVA are One way ANOVA test can be performed…
Q: Assume that when adults with smartphones are randomly selected, 56% use them in meetings or…
A: Binomial distribution describes the possible number of events occurs in fixed number of trials.…
Q: The distribution of heights in a population of women is approximately normal. Sixteen percent of the…
A: given data normal distribution empirical rule: approximately 68 -95 -99.7% data fall within 1σ…
Q: Annual per capita consumption of milk is 21.6 gallons (Statistical Abstract of the United States:…
A: From the provided information, the followings are interpreted. The stated per capita consumption of…
Q: We obtain the following demand curve of beef in a market with 25 observations: Q = 635.736 - 48.165…
A: Given that The standard error of the slope coefficient is 2.546 Sample size n =25
Q: You run a regression analysis on a bivariate set of data (n=82n=82). With ¯x=50.7 and ¯y=65.7, you…
A:
Q: The probability that a student chosen at random from your class is a French major is 0.05.…
A: Answer: From the given data, The probability that a student chosen at random from your class is a…
Q: A normal distribution of scores has a standard deviation of 10 and a mean of 0. Find the z-scores…
A: It is given that Mean, μ = 0 Standard deviation, σ = 10 Note: According to Bartleby expert…
Q: (a) n = 8, t= -2.8, a= 0.05 O Reject the null hypothesis. There is sufficient evidence that the true…
A: Given that Null hypothesis = H0 : μ = 7 Alternate hypothesis = H1 : μ < 7 Note : According to…
Q: Given that z is a standard normal random variable, compute the following probabilities. (Round your…
A: Answer:- Given that z is a standard normal random variable, compute the following probabilities.…

Step by step
Solved in 4 steps with 1 images

- Olympic Pole Vault The graph in Figure 7 indicates that in recent years the winning Olympic men’s pole vault height has fallen below the value predicted by the regression line in Example 2. This might have occurred because when the pole vault was a new event there was much room for improvement in vaulters’ performances, whereas now even the best training can produce only incremental advances. Let’s see whether concentrating on more recent results gives a better predictor of future records. (a) Use the data in Table 2 (page 176) to complete the table of winning pole vault heights shown in the margin. (Note that we are using x=0 to correspond to the year 1972, where this restricted data set begins.) (b) Find the regression line for the data in part ‚(a). (c) Plot the data and the regression line on the same axes. Does the regression line seem to provide a good model for the data? (d) What does the regression line predict as the winning pole vault height for the 2012 Olympics? Compare this predicted value to the actual 2012 winning height of 5.97 m, as described on page 177. Has this new regression line provided a better prediction than the line in Example 2?1) What is the probability of a stroke over the next 10 years for John Smith, a 68-year-old smoker who has blood pressure of 175? What action might the physician recommend for John to reduce the risk of stroke? 2) Is there any multicollinearity problem in the above multiple regression model? How do you know?A manufacturer of car batteries claims that the mean lifetime of their battery is 67 months. Thinking that this claim is inflated, graduate students buy a random sample of 72 car batteries from this manufacturer. How should they proceed? a) Perform a hypothesis test of H0:μ=67 versus Ha:μ>67 b) Perform a hypothesis test of H0:μ=67 versus Ha:μ<67 c) Use Simple linear regression
- 9)Suppose that Y is normal and we have three explanatory unknowns which are also normal, and we have an independent random sample of 11 members of the population, where for each member, the value of Y as well as the values of the three explanatory unknowns were observed. The data is entered into a computer using linear regression software and the output summary tells us that R-square is 0.79, the linear model coefficient of the first explanatory unknown is 7 with standard error estimate 2.5, the coefficient for the second explanatory unknown is 11 with standard error 2, and the coefficient for the third explanatory unknown is 15 with standard error 4. The regression intercept is reported as 28. The sum of squares in regression (SSR) is reported as 79000 and the sum of squared errors (SSE) is 21000. From this information, what is the adjusted R-square? .8 .7 NONE OF THE OTHERS .6 .5If a sample of 25 pairs of data yields a correlation coefficient, r, of 0.390 and the scatterplot displays a linear trend, can you use the regression equation to make predictions, assuming your x-values are within the domain of the data set? Choose your answer from the multiple choice answers below A.) Yes, because rcrit = 0.396 and the regression coefficient, r, is less than this value. B.) Yes, because rcrit = 0.381 and the regression coefficient, r, is greater than this value. C.) No, because rcrit = 0.381 and the regression coefficient, r, is greater than this value. D.) No, because rcrit = 0.396 and the regression coefficient, r, is less than this value.17) Suppose that Y is normal and we have three explanatory unknowns which are also normal, and we have an independent random sample of 41 members of the population, where for each member, the value of Y as well as the values of the three explanatory unknowns were observed. The data is entered into a computer using linear regression software and the output summary tells us that R-square is 0.9, the linear model coefficient of the first explanatory unknown is 7 with standard error estimate 2.5, the coefficient for the second explanatory unknown is 11 with standard error 2, and the coefficient for the third explanatory unknown is 15 with standard error 4. The regression intercept is reported as 28. The sum of squares in regression (SSR) is reported as 90000 and the sum of squared errors (SSE) is 10000. From this information, what is the number of degrees of freedom for the t-distribution used to compute critical values for hypothesis tests and confidence intervals for the individual…

