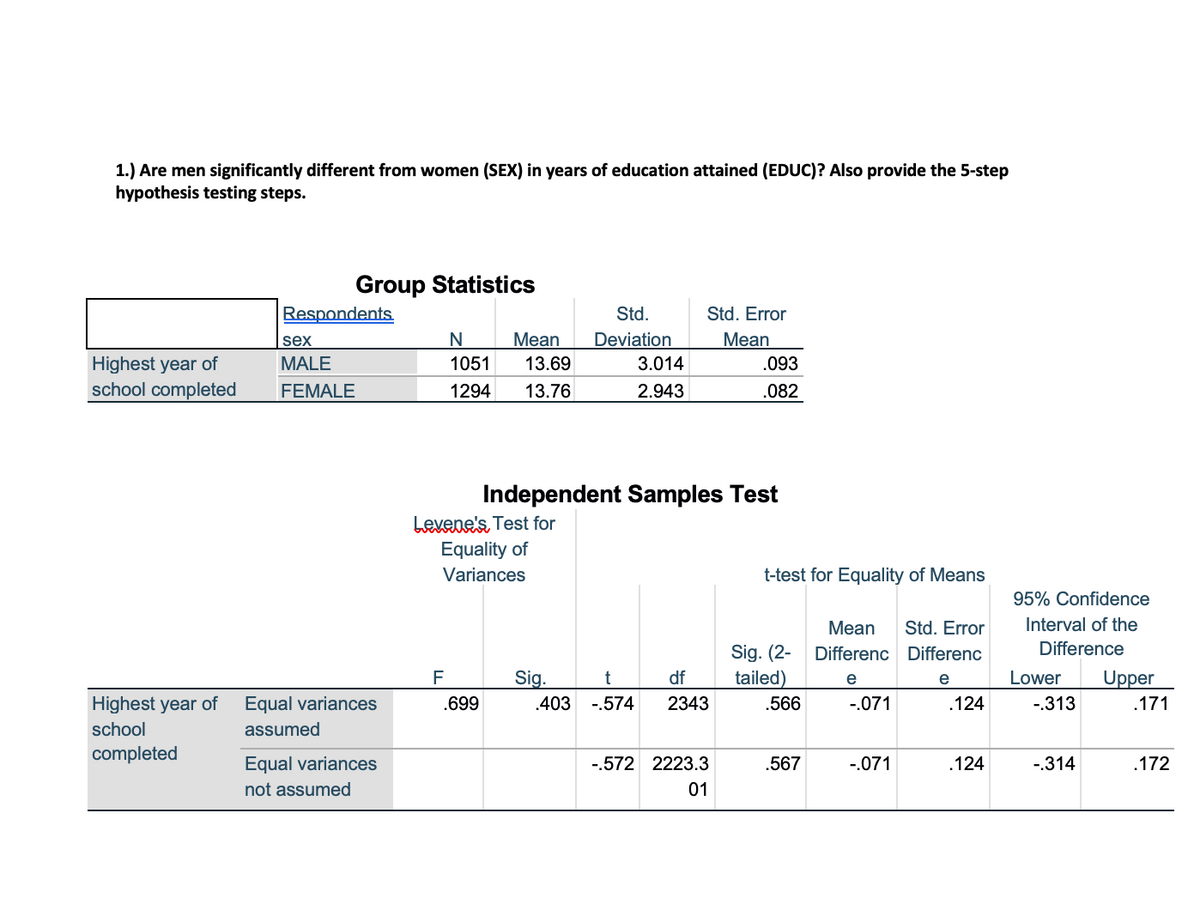
1.) Are men significantly different from women (SEX) in years of education attained (EDUC)? Also provide the 5-step hypothesis testing steps. Group Statistics Respondents Std. Std. Error N Мean 13.69 Deviation 3.014 Mean .093 sex Highest year of school completed MALE 1051 FEMALE 1294 13.76 2.943 .082 Independent Samples Test Lexene's Test for Equality of Variances t-test for Equality of Means 95% Confidence Mean Std. Error Interval of the Sig. (2- Differenc Differenc Difference F Sig. df Lower Upper .171 tailed) e e Highest year of Equal variances .699 .403 -.574 2343 .566 -.071 .124 -.313 school assumed completed Equal variances -.572 2223.3 .567 -.071 .124 -.314 .172 not assumed 01
1.) Are men significantly different from women (SEX) in years of education attained (EDUC)? Also provide the 5-step hypothesis testing steps. Group Statistics Respondents Std. Std. Error N Мean 13.69 Deviation 3.014 Mean .093 sex Highest year of school completed MALE 1051 FEMALE 1294 13.76 2.943 .082 Independent Samples Test Lexene's Test for Equality of Variances t-test for Equality of Means 95% Confidence Mean Std. Error Interval of the Sig. (2- Differenc Differenc Difference F Sig. df Lower Upper .171 tailed) e e Highest year of Equal variances .699 .403 -.574 2343 .566 -.071 .124 -.313 school assumed completed Equal variances -.572 2223.3 .567 -.071 .124 -.314 .172 not assumed 01

Holt Mcdougal Larson Pre-algebra: Student Edition 2012
1st Edition
ISBN:9780547587776
Author:HOLT MCDOUGAL
Publisher:HOLT MCDOUGAL
Chapter11: Data Analysis And Probability
Section: Chapter Questions
Problem 8CR

Related questions
Question
Picture attached, use the graph to find the answer
Question: Are men significantly different from women (SEX) in years of education attained (EDUC)? Also provide the 5-step hypothesis testing steps.
Transcribed Image Text:1.) Are men significantly different from women (SEX) in years of education attained (EDUC)? Also provide the 5-step
hypothesis testing steps.
Group Statistics
Respondents
Std.
Std. Error
Mean
Deviation
Mean
sex
MALE
Highest year of
school completed
1051
13.69
3.014
.093
FEMALE
1294
13.76
2.943
.082
Independent Samples Test
Levene's Test for
Equality of
Variances
t-test for Equality of Means
95% Confidence
Mean
Std. Error
Interval of the
Difference
Sig. (2-
tailed)
Differenc Differenc
F
Sig.
t
df
Lower
Upper
e
e
Highest year of
Equal variances
.699
.403
-.574
2343
.566
-.071
.124
-.313
.171
school
assumed
completed
Equal variances
-.572 2223.3
.567
-.071
.124
-.314
.172
not assumed
01
Expert Solution
This question has been solved!
Explore an expertly crafted, step-by-step solution for a thorough understanding of key concepts.

Step by step
Solved in 2 steps

Knowledge Booster


Learn more about
Need a deep-dive on the concept behind this application? Look no further. Learn more about this topic, statistics and related others by exploring similar questions and additional content below.Recommended textbooks for you
Holt Mcdougal Larson Pre-algebra: Student Edition…
Algebra
ISBN:
9780547587776
Author:
HOLT MCDOUGAL
Publisher:
HOLT MCDOUGAL
Holt Mcdougal Larson Pre-algebra: Student Edition…
Algebra
ISBN:
9780547587776
Author:
HOLT MCDOUGAL
Publisher:
HOLT MCDOUGAL