An agency is concerned with the time consumed by its customers in filling out forms. A sample taken during opening hours gave the following times: 2.10 2.40 1.30 2.45 2.35 1.15 1.40 1.35 2.25 3.05 3.19 2.36 3.23 3.09 1.45 Compute the mean and the median Compute the variance, range, standard deviation and interquartile range. Is the sample skewed? If so, how?


Inverse Normal Distribution
The method used for finding the corresponding z-critical value in a normal distribution using the known probability is said to be an inverse normal distribution. The inverse normal distribution is a continuous probability distribution with a family of two parameters.
Mean, Median, Mode
It is a descriptive summary of a data set. It can be defined by using some of the measures. The central tendencies do not provide information regarding individual data from the dataset. However, they give a summary of the data set. The central tendency or measure of central tendency is a central or typical value for a probability distribution.
Z-Scores
A z-score is a unit of measurement used in statistics to describe the position of a raw score in terms of its distance from the mean, measured with reference to standard deviation from the mean. Z-scores are useful in statistics because they allow comparison between two scores that belong to different normal distributions.
- An agency is concerned with the time consumed by its customers in filling out forms. A sample taken during opening hours gave the following times:
2.10 2.40 1.30 2.45 2.35 1.15 1.40 1.35 2.25 3.05 3.19 2.36 3.23 3.09 1.45
- Compute the mean and the median
- Compute the variance,
range , standard deviation andinterquartile range . - Is the sample skewed? If so, how?
- Compute the coefficient of variation and the Z scores. Are there any outliers? Explain.
(1)
Obtain the value of the mean.
The value of the mean is obtained below as follows:
Use EXCEL Procedure for finding the value of mean.
Follow the instruction to obtain the value of mean.
- Open EXCEL
- Go to Formula bar.
- In formula bar enter the function as“=AVERAGE”
- Enter the range as $A$1:$A$16.
- Click enter.
EXCEL output:
From the EXCEL output, the value of the mean is 2.208.
Thus, the value of mean is 2.208.
Obtain the value of the median
The value of the median is obtained below as follows:
Use EXCEL Procedure for finding the value of median.
Follow the instruction to obtain the value of mean.
- Open EXCEL
- Go to Formula bar.
- In formula bar enter the function as“=MEDIAN”
- Enter the range as $A$1:$A$16.
- Click enter.
EXCEL output:
From the EXCEL output, the value of the median is 2.35.
The value of the median is 2.35.
(2)
Obtain the value of the variance
The value of the variance is obtained below as follows:
Use EXCEL Procedure for finding the value of variance.
Follow the instruction to obtain the value of variance.
- Open EXCEL
- Go to Formula bar.
- In formula bar enter the function as“=VAR”
- Enter the range as $A$1:$A$16.
- Click enter.
EXCEL output:
From the EXCEL output, the value of the variance is 0.5397.
Thus, the value of variance is 0.5397.
Obtain the value of the range
The value of the range is obtained below as follows:
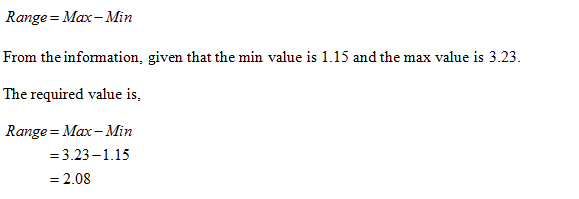
The value of the range is 2.08.
Use EXCEL Procedure for finding the value of sample standard deviation.
Follow the instruction to obtain the value of sample standard deviation.
- Open EXCEL
- Go to Formula bar.
- In formula bar enter the function as“=STDEV”
- Enter the range as $A$1:$A$16.
- Click enter.
EXCEL output:
From the EXCEL output, the value of the sample standard deviation is 0.7346
Thus, the value of sample standard deviation is 0.7346.
Obtain the value of IQR.
The value of IQR is obtained below as follows:

Use EXCEL Procedure for finding the value of Quartile 1.
Follow the instruction to obtain the value of Quartile 1.
- Open EXCEL
- Go to Formula bar.
- In formula bar enter the function as“=QUARTILE”
- Enter the range as $A$1:$A$16.
- Click enter.
EXCEL output:
From the EXCEL output, the value of the Quartile 1 is 1.425
Thus, the value of Quartile 1is 1.425.
Use EXCEL Procedure for finding the value of Quartile 3.
Follow the instruction to obtain the value of Quartile 3.
- Open EXCEL
- Go to Formula bar.
- In formula bar enter the function as“=QUARTILE”
- Enter the range as $A$1:$A$16.
- Click enter.
EXCEL output:
From the EXCEL output, the value of the Quartile 3 is 2.75
Thus, the value of Quartile 3 is 2.75
The required value is,
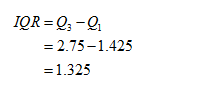
The value of IQR is 1.325.

Step by step
Solved in 3 steps with 3 images


