1. As of August 12, 2021, these are the countries with confirmed COVID-19 cases ranging from one to 250. Refer to the table below. a. Construct the appropriate frequency distribution table. Compute the measure of tendency and dispersion of the confirmed cases using grouped data. Use 50 as class size. b. Draw the following graphs: 1. Histogram 2. Cumulative frequency ogive Country Confirmed Cases Number of Recoveries Number of Deaths Greenland 201 131 Grenada 180 167 1 Brunei 141 138 New Caledonia 134 58 Anguilla 113 111 Масао 63 57 Puerto Rico 39 1 2 Guam 32 1 Vatican City 27 27 Montserrat 22 20 1 Solomon Islands 20 20 U.S. Virgin Islands 17 Western Sahara 10 8. 1 Marshall Islands 4 4 Vanuatu 1 Samoa 3 3 Saint Helena Kosovo 2 Micronesia 1 1
1. As of August 12, 2021, these are the countries with confirmed COVID-19 cases ranging from one to 250. Refer to the table below. a. Construct the appropriate frequency distribution table. Compute the measure of tendency and dispersion of the confirmed cases using grouped data. Use 50 as class size. b. Draw the following graphs: 1. Histogram 2. Cumulative frequency ogive Country Confirmed Cases Number of Recoveries Number of Deaths Greenland 201 131 Grenada 180 167 1 Brunei 141 138 New Caledonia 134 58 Anguilla 113 111 Масао 63 57 Puerto Rico 39 1 2 Guam 32 1 Vatican City 27 27 Montserrat 22 20 1 Solomon Islands 20 20 U.S. Virgin Islands 17 Western Sahara 10 8. 1 Marshall Islands 4 4 Vanuatu 1 Samoa 3 3 Saint Helena Kosovo 2 Micronesia 1 1

Glencoe Algebra 1, Student Edition, 9780079039897, 0079039898, 2018
18th Edition
ISBN:9780079039897
Author:Carter
Publisher:Carter
Chapter10: Statistics
Section10.6: Summarizing Categorical Data
Problem 4BGP

Related questions
Question
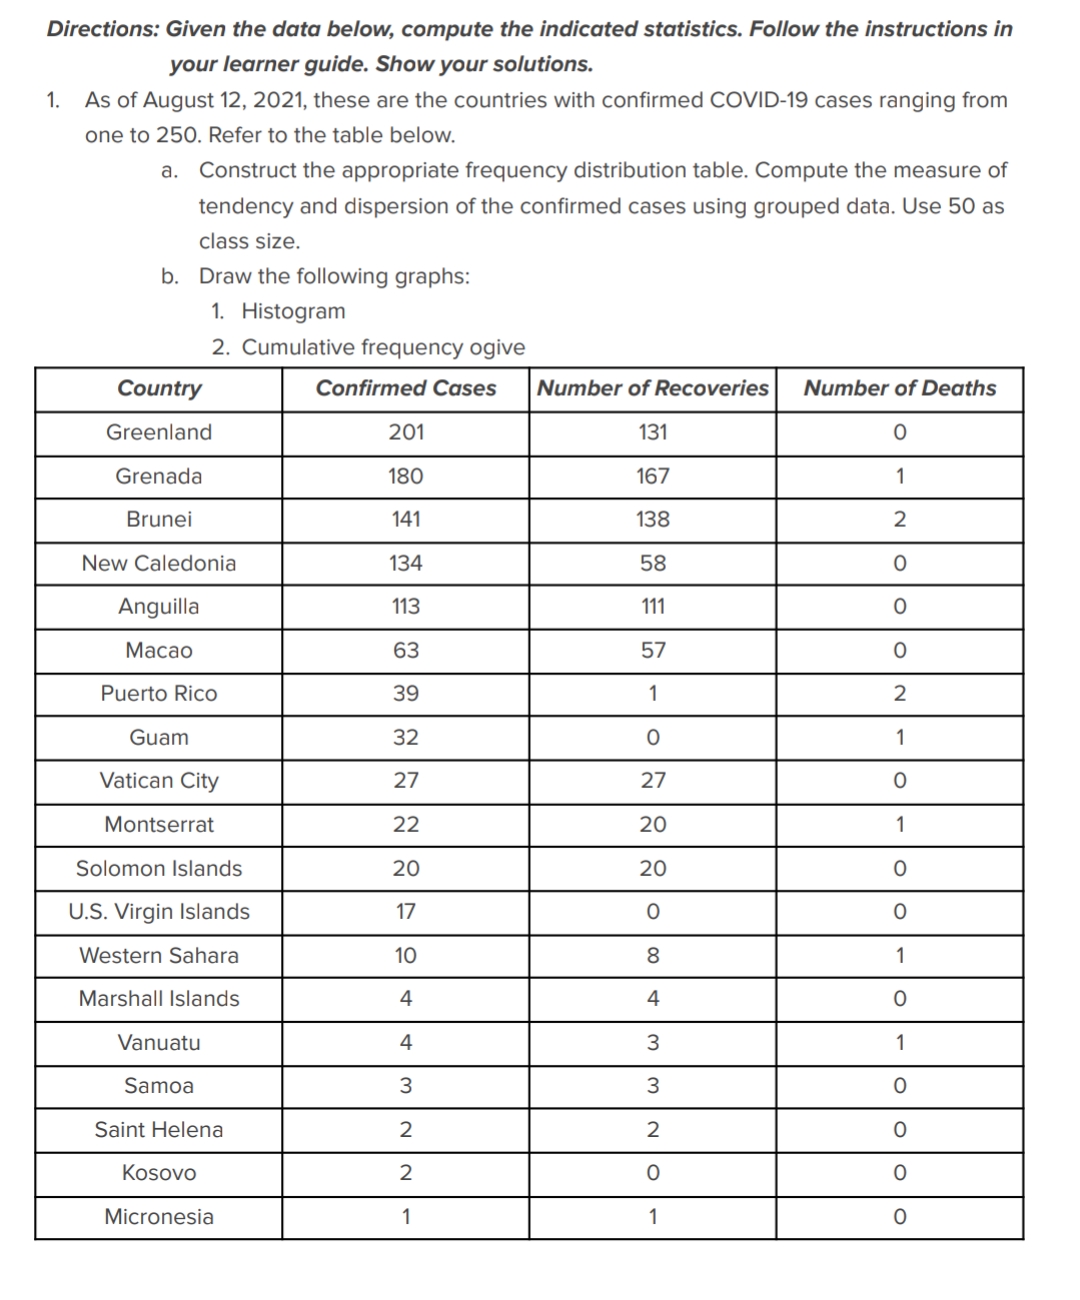
Transcribed Image Text:Directions: Given the data below, compute the indicated statistics. Follow the instructions in
your learner guide. Show your solutions.
1.
As of August 12, 2021, these are the countries with confirmed COVID-19 cases ranging from
one to 250. Refer to the table below.
a. Construct the appropriate frequency distribution table. Compute the measure of
tendency and dispersion of the confirmed cases using grouped data. Use 50 as
class size.
b. Draw the following graphs:
1. Histogram
2. Cumulative frequency ogive
Country
Confirmed Cases
Number of Recoveries
Number of Deaths
Greenland
201
131
Grenada
180
167
1
Brunei
141
138
2
New Caledonia
134
58
Anguilla
113
111
Масаo
63
57
Puerto Rico
39
1
Guam
32
1
Vatican City
27
27
Montserrat
22
20
1
Solomon Islands
20
20
U.S. Virgin Islands
17
Western Sahara
10
8
1
Marshall Islands
4
4
Vanuatu
4
3
1
Samoa
Saint Helena
2
2
Kosovo
Micronesia
1
1
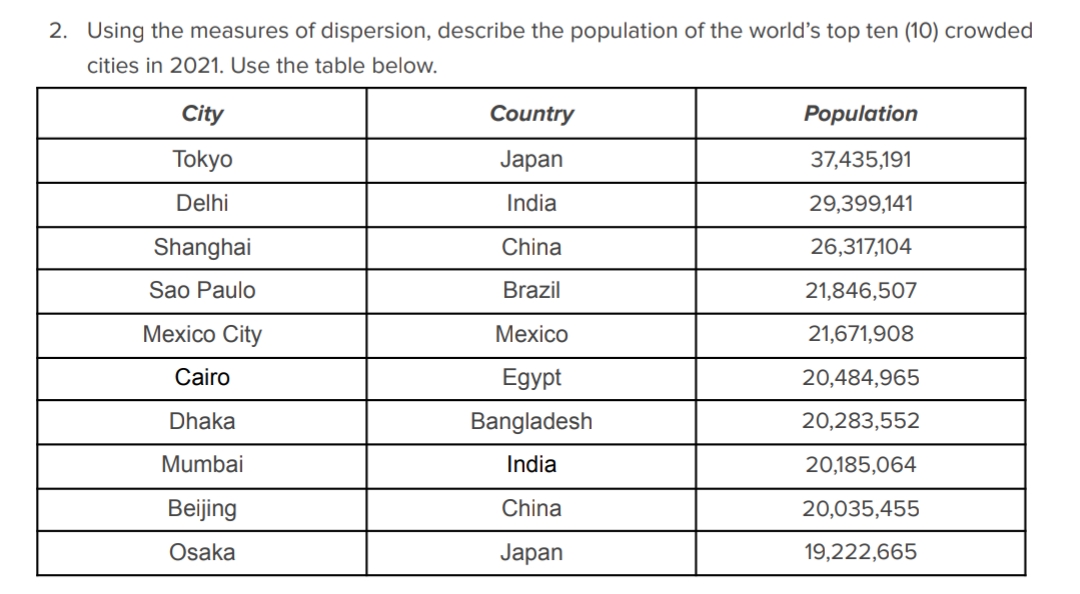
Transcribed Image Text:2. Using the measures of dispersion, describe the population of the world's top ten (10) crowded
cities in 2021. Use the table below.
City
Country
Population
Tokyo
Japan
37,435,191
Delhi
India
29,399,141
Shanghai
China
26,317,104
Sao Paulo
Brazil
21,846,507
Меxico City
Mexico
21,671,908
Cairo
Egypt
20,484,965
Dhaka
Bangladesh
20,283,552
Mumbai
India
20,185,064
Beijing
China
20,035,455
Osaka
Japan
19,222,665
Expert Solution
This question has been solved!
Explore an expertly crafted, step-by-step solution for a thorough understanding of key concepts.

Step by step
Solved in 2 steps with 9 images

Recommended textbooks for you
Glencoe Algebra 1, Student Edition, 9780079039897…
Algebra
ISBN:
9780079039897
Author:
Carter
Publisher:
McGraw Hill
Glencoe Algebra 1, Student Edition, 9780079039897…
Algebra
ISBN:
9780079039897
Author:
Carter
Publisher:
McGraw Hill