Below are the jersey numbers of 11 players randomly selected from a football team. Find the range, variance, and standard deviation for the given sample data. What do the results tell us 52 33 7 54 20 76 81 7o 8 68 74 D Range = (Round to one decimal place as needed.) Sample standard deviation = (Round to one decimal place as needed.) Sample variance = (Round to one decimal place as needed.) What do the results tell us? O A. The sample standard deviation is too large in comparison to the range. O B. Jersey numbers on a football team do not vary as much as expected. O C. Jersey numbers on a football team vary much more than expected. O D. Jersey numbers are nominal data that are just replacements for names, so the resulting statistics are meaningless.
Below are the jersey numbers of 11 players randomly selected from a football team. Find the range, variance, and standard deviation for the given sample data. What do the results tell us 52 33 7 54 20 76 81 7o 8 68 74 D Range = (Round to one decimal place as needed.) Sample standard deviation = (Round to one decimal place as needed.) Sample variance = (Round to one decimal place as needed.) What do the results tell us? O A. The sample standard deviation is too large in comparison to the range. O B. Jersey numbers on a football team do not vary as much as expected. O C. Jersey numbers on a football team vary much more than expected. O D. Jersey numbers are nominal data that are just replacements for names, so the resulting statistics are meaningless.

Glencoe Algebra 1, Student Edition, 9780079039897, 0079039898, 2018
18th Edition
ISBN:9780079039897
Author:Carter
Publisher:Carter
Chapter10: Statistics
Section10.5: Comparing Sets Of Data
Problem 14PPS

Related questions
Question
67 and 69 solve both
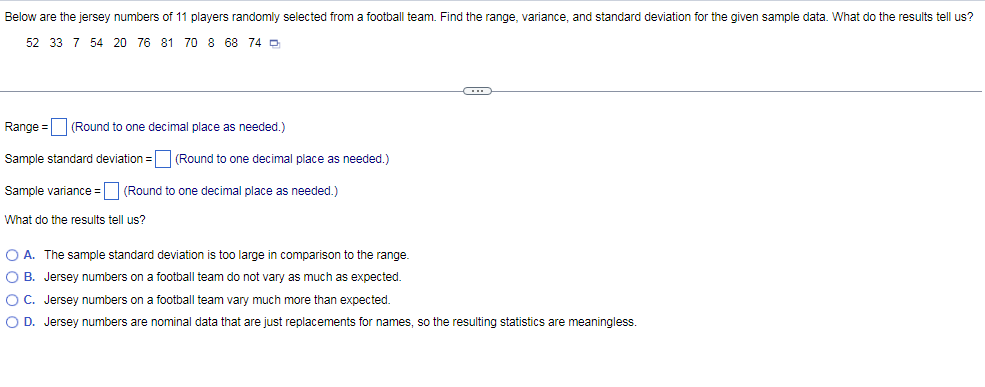
Transcribed Image Text:Below are the jersey numbers of 11 players randomly selected from a football team. Find the range, variance, and standard deviation for the given sample data. What do the results tell us?
52 33 7 54 20 76 81 70 8 68 74 D
Range = (Round to one decimal place as needed.)
Sample standard deviation = (Round to one decimal place as needed.)
Sample variance = (Round to one decimal place as needed.)
What do the results tell us?
O A. The sample standard deviation is too large in comparison to the range.
O B. Jersey numbers on a football team do not vary as much as expected.
OC. Jersey numbers on a football team vary much more than expected.
O D. Jersey numbers are nominal data that are just replacements for names, so the resulting statistics are meaningless.
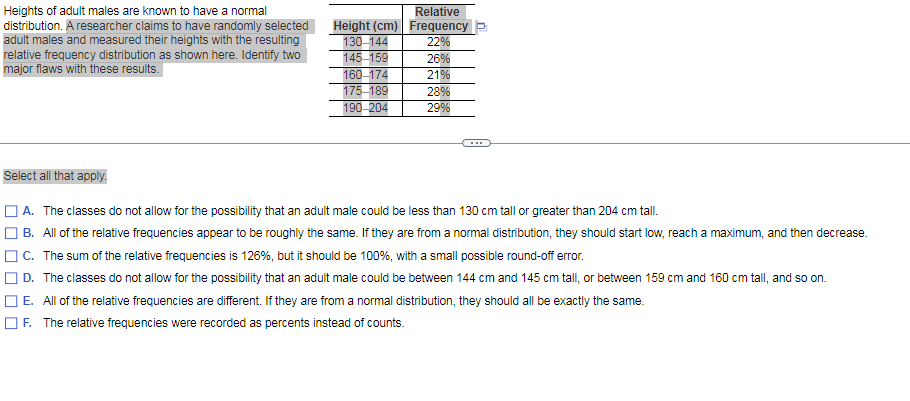
Transcribed Image Text:Heights of adult males are known to have a normal
distribution. A researcher claims to have randomly selected
adult males and measured their heights with the resulting
Relative
Height (cm) Frequency
130-144
22%
relative frequency distribution as shown here. Identify two
major flaws with these results.
145-159
26%
160-174
175-189
190 204
21%
28%
29%
Select all that apply.
A. The classes do not allow for the possibility that an adult male could be less than 130 cm tall or greater than 204 cm tall.
B. All of the relative frequencies appear to be roughly the same. If they are from a normal distribution, they should start low, reach a maximum, and then decrease.
Oc. The sum of the relative frequencies is 126%, but it should be 100%, with a small possible round-off error.
D. The classes do not allow for the possibility that an adult male could be between 144 cm and 145 cm tall, or between 159 cm and 160 cm tall, and so on.
DE. All of the relative frequencies are different. If they are from a normal distribution, they should all be exactly the same.
OF. The relative frequencies were recorded as percents instead of counts.
Expert Solution
This question has been solved!
Explore an expertly crafted, step-by-step solution for a thorough understanding of key concepts.

This is a popular solution!

Trending now
This is a popular solution!

Step by step
Solved in 4 steps with 3 images

Recommended textbooks for you
Glencoe Algebra 1, Student Edition, 9780079039897…
Algebra
ISBN:
9780079039897
Author:
Carter
Publisher:
McGraw Hill
Glencoe Algebra 1, Student Edition, 9780079039897…
Algebra
ISBN:
9780079039897
Author:
Carter
Publisher:
McGraw Hill