Apply the concept of probability distribution and show your complete solution

Chapter9: Sequences, Probability And Counting Theory
Section9.5: Counting Principles
Problem 43SE: A wholesale T-shirt company oilers sizes small, medium, large, and extra-large in organic or non-...

Related questions
Question
Apply the concept of
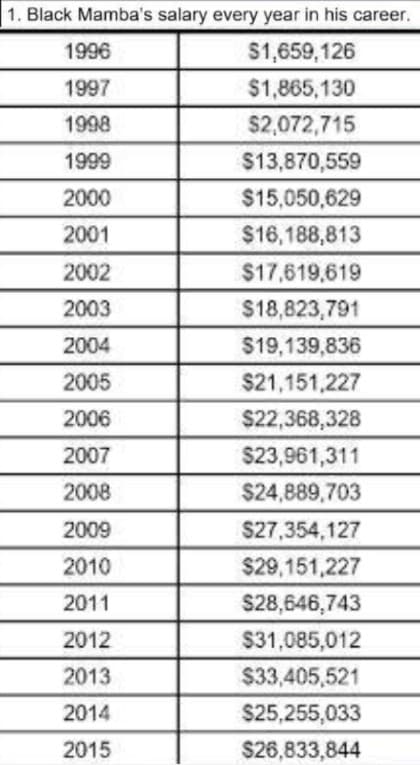
Transcribed Image Text:1. Black Mamba's salary every year in his career.
1996
$1,659,126
1997
$1,865,130
1998
$2,072,715
1999
$13,870,559
2000
$15,050,629
2001
$16,188,813
2002
$17,619,619
2003
$18,823,791
2004
$19,139,836
2005
$21,151,227
2006
$22,368,328
2007
$23,961,311
2008
$24,889,703
2009
$27,354,127
2010
$29,151,227
2011
$28,646,743
2012
$31,085,012
2013
$33,405,521
2014
$25,255,033
2015
$26,833,844
Expert Solution
This question has been solved!
Explore an expertly crafted, step-by-step solution for a thorough understanding of key concepts.

Step by step
Solved in 2 steps

Recommended textbooks for you