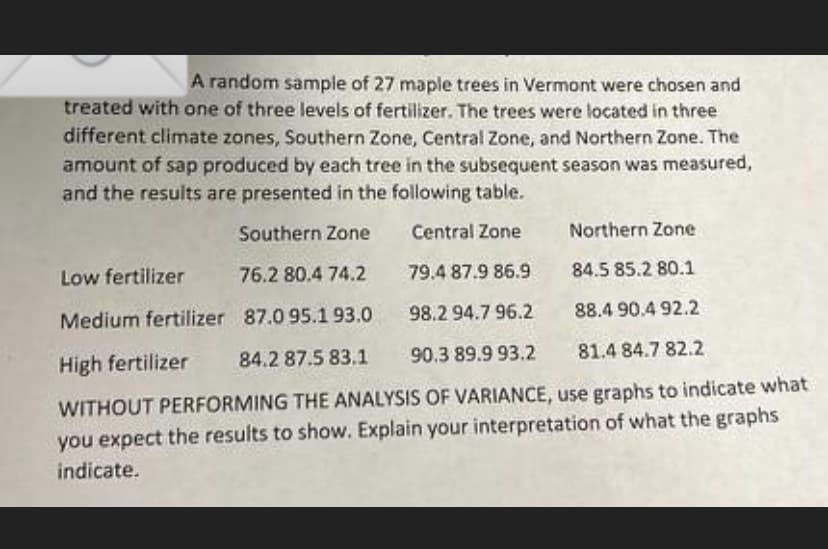
A random sample of 27 maple trees in Vermont were chosen and treated with one of three levels of fertilizer. The trees were located in three different climate zones, Southern Zone, Central Zone, and Northern Zone. The amount of sap produced by each tree in the subsequent season was measured, and the results are presented in the following table. Southern Zone Central Zone Northern Zone Low fertilizer 76.2 80.4 74.2 79.4 87.9 86.9 84.5 85.2 80.1 Medium fertilizer 87.0 95.193.0 98.2 94.7 96.2 88.4 90.4 92.2 84.2 87.5 83.1 90.3 89.9 93.2 81.4 84.7 82.2 High fertilizer WITHOUT PERFORMING THE ANALYSIS OF VARIANCE, use graphs to indicate what you expect the results to show. Explain your interpretation of what the graphs indicate.
A random sample of 27 maple trees in Vermont were chosen and treated with one of three levels of fertilizer. The trees were located in three different climate zones, Southern Zone, Central Zone, and Northern Zone. The amount of sap produced by each tree in the subsequent season was measured, and the results are presented in the following table. Southern Zone Central Zone Northern Zone Low fertilizer 76.2 80.4 74.2 79.4 87.9 86.9 84.5 85.2 80.1 Medium fertilizer 87.0 95.193.0 98.2 94.7 96.2 88.4 90.4 92.2 84.2 87.5 83.1 90.3 89.9 93.2 81.4 84.7 82.2 High fertilizer WITHOUT PERFORMING THE ANALYSIS OF VARIANCE, use graphs to indicate what you expect the results to show. Explain your interpretation of what the graphs indicate.

Functions and Change: A Modeling Approach to College Algebra (MindTap Course List)
6th Edition
ISBN:9781337111348
Author:Bruce Crauder, Benny Evans, Alan Noell
Publisher:Bruce Crauder, Benny Evans, Alan Noell
Chapter5: A Survey Of Other Common Functions
Section5.3: Modeling Data With Power Functions
Problem 6E: Urban Travel Times Population of cities and driving times are related, as shown in the accompanying...

Related questions
Question
Transcribed Image Text:A random sample of 27 maple trees in Vermont were chosen and
treated with one of three levels of fertilizer. The trees were located in three
different climate zones, Southern Zone, Central Zone, and Northern Zone. The
amount of sap produced by each tree in the subsequent season was measured,
and the results are presented in the following table.
Southern Zone
Central Zone
Northern Zone
Low fertilizer
76.2 80.4 74.2
79.4 87.9 86.9
84.5 85.2 80.1
Medium fertilizer
87.0 95.1 93.0
98.2 94.7 96.2
88.4 90.4 92.2
High fertilizer
84.2 87.5 83.1
90.3 89.9 93.2
81.4 84.7 82.2
WITHOUT PERFORMING THE ANALYSIS OF VARIANCE, use graphs to indicate what
you expect the results to show. Explain your interpretation of what the graphs
indicate.
Expert Solution
This question has been solved!
Explore an expertly crafted, step-by-step solution for a thorough understanding of key concepts.

This is a popular solution!

Trending now
This is a popular solution!

Step by step
Solved in 7 steps with 7 images

Recommended textbooks for you
Functions and Change: A Modeling Approach to Coll…
Algebra
ISBN:
9781337111348
Author:
Bruce Crauder, Benny Evans, Alan Noell
Publisher:
Cengage Learning

Holt Mcdougal Larson Pre-algebra: Student Edition…
Algebra
ISBN:
9780547587776
Author:
HOLT MCDOUGAL
Publisher:
HOLT MCDOUGAL

Glencoe Algebra 1, Student Edition, 9780079039897…
Algebra
ISBN:
9780079039897
Author:
Carter
Publisher:
McGraw Hill
Functions and Change: A Modeling Approach to Coll…
Algebra
ISBN:
9781337111348
Author:
Bruce Crauder, Benny Evans, Alan Noell
Publisher:
Cengage Learning
Holt Mcdougal Larson Pre-algebra: Student Edition…
Algebra
ISBN:
9780547587776
Author:
HOLT MCDOUGAL
Publisher:
HOLT MCDOUGAL
Glencoe Algebra 1, Student Edition, 9780079039897…
Algebra
ISBN:
9780079039897
Author:
Carter
Publisher:
McGraw Hill