1. Circle the data sets that reflects the Law of Supply. Explain why it reflects the Law of Supply. Price Quantity Price Quantity Price Quantity $1.00 $1.00 30 $1.00 20 $2.00 $3.00 $4.00 10 $2.00 $3.00 $4.00 -0 20 $2.00 $3.00 $4.00 30 20 10 10 30 2. Assume that the data set you chose reflects the supply of Chick-fil-A biscuits at RHS on Wednesday mornings. In the space below, graph the demand curve in a fully labeled model.
1. Circle the data sets that reflects the Law of Supply. Explain why it reflects the Law of Supply. Price Quantity Price Quantity Price Quantity $1.00 $1.00 30 $1.00 20 $2.00 $3.00 $4.00 10 $2.00 $3.00 $4.00 -0 20 $2.00 $3.00 $4.00 30 20 10 10 30 2. Assume that the data set you chose reflects the supply of Chick-fil-A biscuits at RHS on Wednesday mornings. In the space below, graph the demand curve in a fully labeled model.

Chapter2: Using Economics To Study Health Issues
Section: Chapter Questions
Problem 1QAP

Related questions

Question
Number 1-4 please
Transcribed Image Text:642O
8.
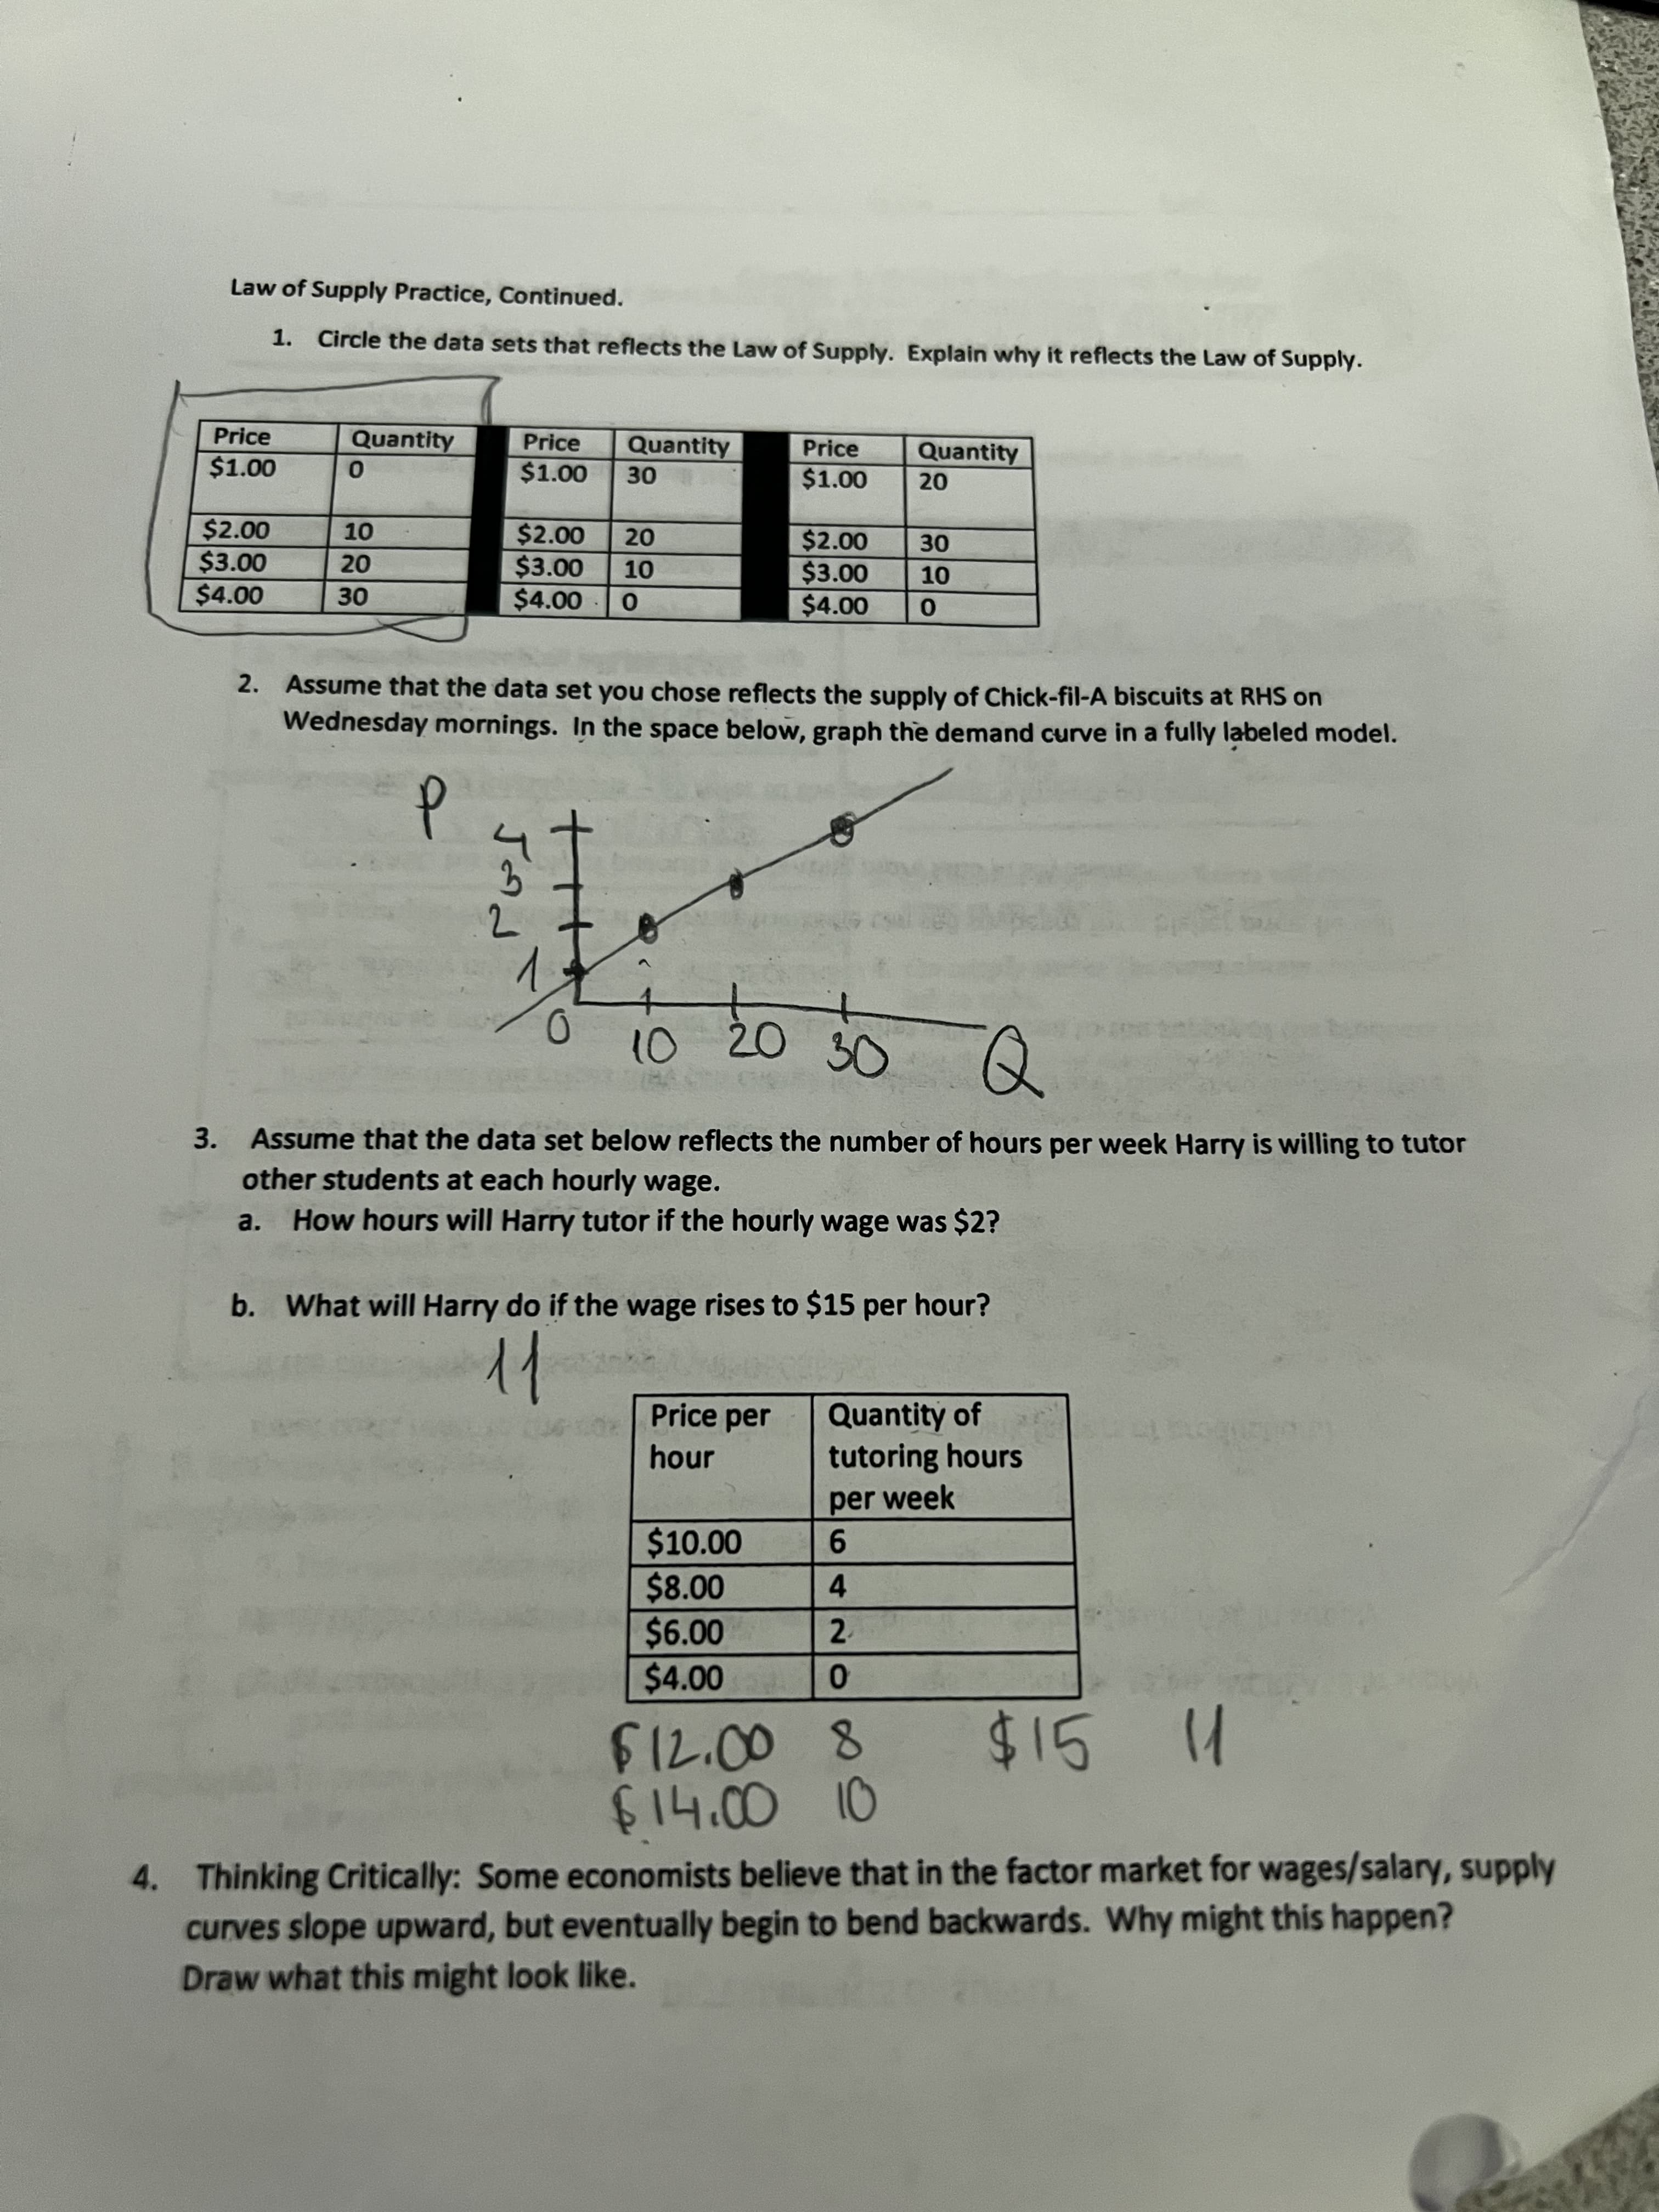
Law of Supply Practice, Continued.
1. Circle the data sets that reflects the Law of Supply. Explain why it reflects the Law of Supply.
Price
Quantity
Price
Quantity
Price
Quantity
$1.00
$1.00
$1.00
$2.00
$3.00
$4.00
$2.00
$3.00
$4.00
$3.00
000
2. Assume that the data set you chose reflects the supply of Chick-fil-A biscuits at RHS on
Wednesday mornings. In the space below, graph the demand curve in a fully labeled model.
0.
10 20
Assume that the data set below reflects the number of hours per week Harry is willing to tutor
other students at each hourly wage.
a. How hours will Harry tutor if the hourly wage was $2?
3.
b. What will Harry do if the wage rises to $15 per hour?
Price per
Quantity of
tutoring hours
hour
per week
$10.00
$8.00
$6.00
$4.00
415
.400
4. Thinking Critically: Some economists believe that in the factor market for wages/salary, supply
2.200
curves slope upward, but eventually begin to bend backwards. Why might this happen?
Draw what this might look like.
Expert Solution
This question has been solved!
Explore an expertly crafted, step-by-step solution for a thorough understanding of key concepts.

This is a popular solution!

Trending now
This is a popular solution!

Step by step
Solved in 5 steps with 2 images

Knowledge Booster


Learn more about
Need a deep-dive on the concept behind this application? Look no further. Learn more about this topic, economics and related others by exploring similar questions and additional content below.Recommended textbooks for you

Principles of Microeconomics
Economics
ISBN:
9781305156050
Author:
N. Gregory Mankiw
Publisher:
Cengage Learning

Principles of Microeconomics
Economics
ISBN:
9781305156050
Author:
N. Gregory Mankiw
Publisher:
Cengage Learning

Economics (MindTap Course List)
Economics
ISBN:
9781337617383
Author:
Roger A. Arnold
Publisher:
Cengage Learning

Exploring Economics
Economics
ISBN:
9781544336329
Author:
Robert L. Sexton
Publisher:
SAGE Publications, Inc
