1. Compare three fictitious companies (Adamson, Malcomb, and Raffler) by calculating the following ratios: current ratio, debt ratio, leverage ratio, and times-interest-earned ratio. Use year-end figures in place of averages where needed for calculating the ratios in this exercise. Based on your computed ratio values, which company looks the least risky?
1. Compare three fictitious companies (Adamson, Malcomb, and Raffler) by calculating the following ratios: current ratio, debt ratio, leverage ratio, and times-interest-earned ratio. Use year-end figures in place of averages where needed for calculating the ratios in this exercise. Based on your computed ratio values, which company looks the least risky?

Cornerstones of Financial Accounting
4th Edition
ISBN:9781337690881
Author:Jay Rich, Jeff Jones
Publisher:Jay Rich, Jeff Jones
Chapter12: Fainancial Statement Analysis
Section: Chapter Questions
Problem 91PSB: Comparing Financial Ratios Presented below are selected ratios for four firms. Tweeter is a...

Related questions
Question
data tables attached with question
thanks for help
appreicated it
4ijt41j
ti4
j4y4
y4
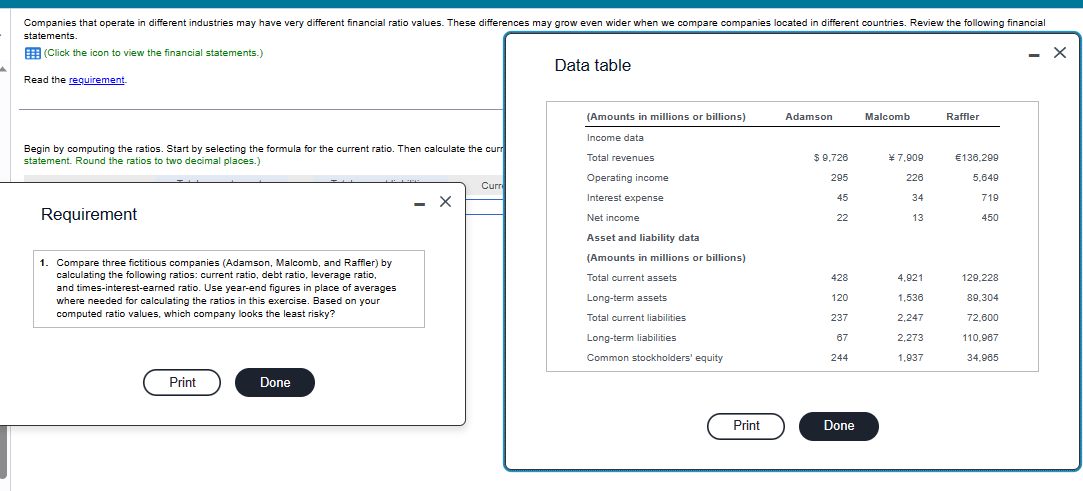
Transcribed Image Text:Companies that operate in different industries may have very different financial ratio values. These differences may grow even wider when we compare companies located in different countries. Review the following financial
statements.
(Click the icon to view the financial statements.)
Read the requirement.
Begin by computing the ratios. Start by selecting the formula for the current ratio. Then calculate the curr
statement. Round the ratios to two decimal places.)
Requirement
1. Compare three fictitious companies (Adamson, Malcomb, and Raffler) by
calculating the following ratios: current ratio, debt ratio, leverage ratio,
and times-interest-earned ratio. Use year-end figures in place of averages
where needed for calculating the ratios in this exercise. Based on your
computed ratio values, which company looks the least risky?
Print
Done
X
Curr
Data table
(Amounts in millions or billions)
Income data
Total revenues
Operating income
Interest expense
Net income
Asset and liability data
(Amounts in millions or billions)
Total current assets
Long-term assets
Total current liabilities
Long-term liabilities
Common stockholders' equity
Print
Adamson
$ 9,726
295
45
22
428
120
237
67
244
Done
Malcomb
€ 7,909
226
34
13
4,921
1,536
2,247
2,273
1,937
Raffler
€136,299
5,649
719
450
129,228
89,304
72,600
110,967
34,965
X
Transcribed Image Text:Companies that operate in different industries may have very different financial ratio values. These differences may grow even wider when we compare companies located in different countries. Review the following financial
statements.
(Click the icon to view the financial statements.)
Read the requirement.
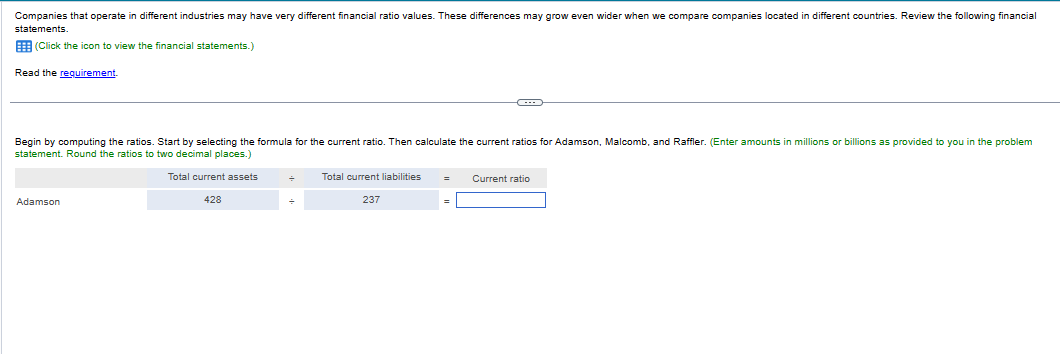
Begin by computing the ratios. Start by selecting the formula for the current ratio. Then calculate the current ratios for Adamson, Malcomb, and Raffler. (Enter amounts in millions or billions as provided to you in the problem
statement. Round the ratios to two decimal places.)
Total current assets
Adamson
428
+
Total current liabilities = Current ratio
237
=
Expert Solution
This question has been solved!
Explore an expertly crafted, step-by-step solution for a thorough understanding of key concepts.

Step by step
Solved in 4 steps

Knowledge Booster


Learn more about
Need a deep-dive on the concept behind this application? Look no further. Learn more about this topic, accounting and related others by exploring similar questions and additional content below.Recommended textbooks for you
Cornerstones of Financial Accounting
Accounting
ISBN:
9781337690881
Author:
Jay Rich, Jeff Jones
Publisher:
Cengage Learning

Fundamentals of Financial Management, Concise Edi…
Finance
ISBN:
9781305635937
Author:
Eugene F. Brigham, Joel F. Houston
Publisher:
Cengage Learning

Financial Accounting: The Impact on Decision Make…
Accounting
ISBN:
9781305654174
Author:
Gary A. Porter, Curtis L. Norton
Publisher:
Cengage Learning
Cornerstones of Financial Accounting
Accounting
ISBN:
9781337690881
Author:
Jay Rich, Jeff Jones
Publisher:
Cengage Learning
Fundamentals of Financial Management, Concise Edi…
Finance
ISBN:
9781305635937
Author:
Eugene F. Brigham, Joel F. Houston
Publisher:
Cengage Learning
Financial Accounting: The Impact on Decision Make…
Accounting
ISBN:
9781305654174
Author:
Gary A. Porter, Curtis L. Norton
Publisher:
Cengage Learning

Financial Reporting, Financial Statement Analysis…
Finance
ISBN:
9781285190907
Author:
James M. Wahlen, Stephen P. Baginski, Mark Bradshaw
Publisher:
Cengage Learning