1. Construct a relative frequency histogram for the voltage readings of the old process. 2. Construct a stem-and-leaf display for the voltage readings of the old process. Which of the two graphs in parts an and b is more informative? 3. Construct a frequency histogram for the voltage readings of the new process. 4. Compare the two graphs in parts a and c. (You may want to draw the two histograms on the same graph.) Does it appear that the manufacturing process can be established locally (i.e., is the new process as good as or better than the old)? 5)- Find and interpret the sample mean and median for each of the voltage readings data sets in Problem 4. Which is the preferred measure of center tendency? Explain.
1. Construct a relative frequency histogram for the voltage readings of the old process. 2. Construct a stem-and-leaf display for the voltage readings of the old process. Which of the two graphs in parts an and b is more informative? 3. Construct a frequency histogram for the voltage readings of the new process. 4. Compare the two graphs in parts a and c. (You may want to draw the two histograms on the same graph.) Does it appear that the manufacturing process can be established locally (i.e., is the new process as good as or better than the old)? 5)- Find and interpret the sample mean and median for each of the voltage readings data sets in Problem 4. Which is the preferred measure of center tendency? Explain.

Linear Algebra: A Modern Introduction
4th Edition
ISBN:9781285463247
Author:David Poole
Publisher:David Poole
Chapter2: Systems Of Linear Equations
Section2.4: Applications
Problem 2EQ: 2. Suppose that in Example 2.27, 400 units of food A, 500 units of B, and 600 units of C are placed...

Related questions

Topic Video
Question
Please solve question 5.
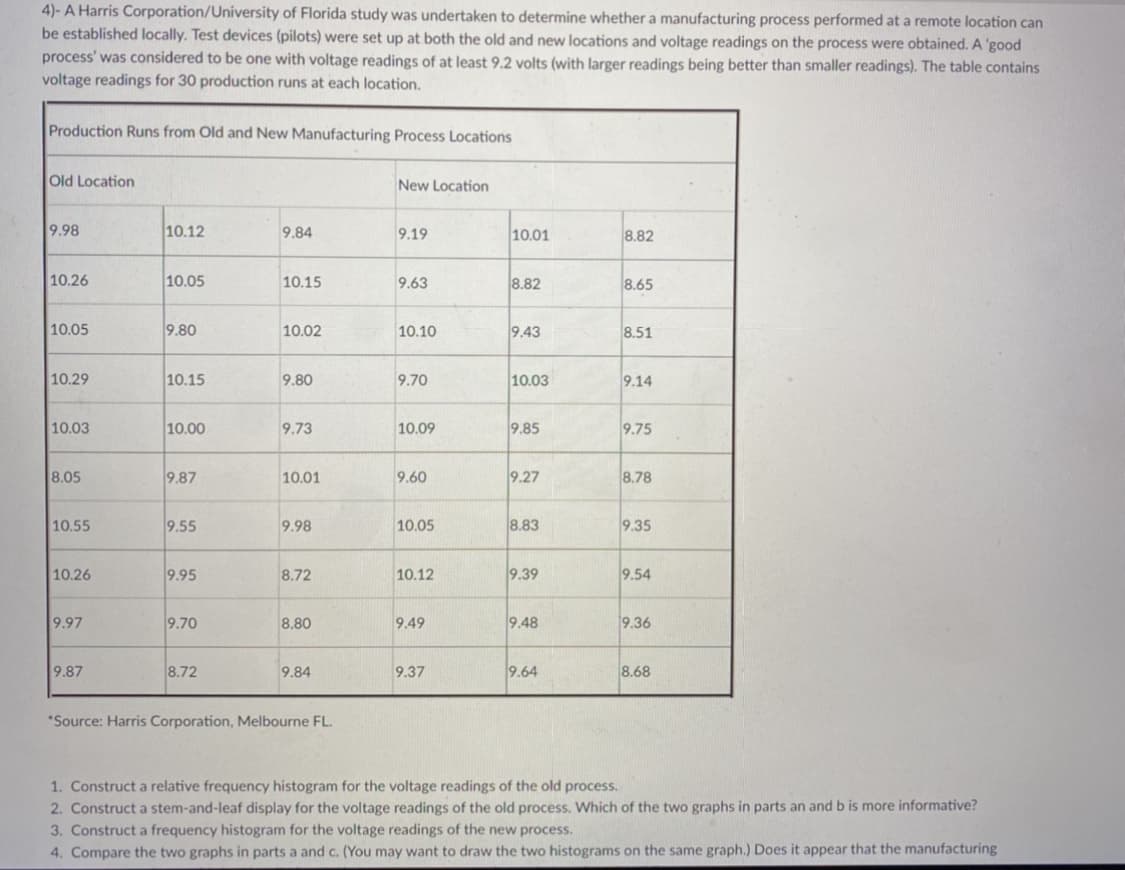
Transcribed Image Text:4)- A Harris Corporation/University of Florida study was undertaken to determine whether a manufacturing process performed at a remote location can
be established locally. Test devices (pilots) were set up at both the old and new locations and voltage readings on the process were obtained. A 'good
process' was considered to be one with voltage readings of at least 9.2 volts (with larger readings being better than smaller readings). The table contains
voltage readings for 30 production runs at each location.
Production Runs from Old and New Manufacturing Process Locations
Old Location
New Location
9.98
10.12
9.84
9.19
10.01
8.82
10.26
10.05
10.15
9.63
8.82
8.65
10.05
9.80
10.02
10.10
9.43
8.51
10.29
10.15
9.80
9.70
10.03
9.14
10.03
10.00
9.73
10.09
9.85
9.75
8.05
9.87
10.01
9.60
9.27
8.78
10.55
9.55
9.98
10.05
8.83
9.35
10.26
9.95
8.72
10.12
9.39
9.54
9.97
9.70
8.80
9.49
9.48
9.36
9.87
8.72
9.84
9.37
9.64
8.68
*Source: Harris Corporation, Melbourne FL.
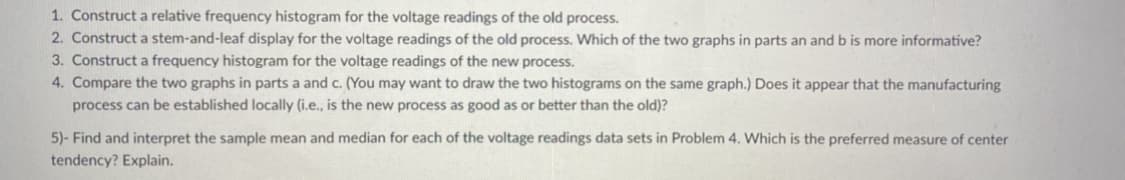
1. Construct a relative frequency histogram for the voltage readings of the old process.
2. Construct a stem-and-leaf display for the voltage readings of the old process. Which of the two graphs in parts an andb is more informative?
3. Construct a frequency histogram for the voltage readings of the new process.
4. Compare the two graphs in parts a and c. (You may want to draw the two histograms on the same graph.) Does it appear that the manufacturing
Transcribed Image Text:1. Construct a relative frequency histogram for the voltage readings of the old process.
2. Construct a stem-and-leaf display for the voltage readings of the old process. Which of the two graphs in parts an and b is more informative?
3. Construct a frequency histogram for the voltage readings of the new process.
4. Compare the two graphs in parts a and c. (You may want to draw the two histograms on the same graph.) Does it appear that the manufacturing
process can be established locally (i.e., is the new process as good as or better than the old)?
5)- Find and interpret the sample mean and median for each of the voltage readings data sets in Problem 4. Which is the preferred measure of center
tendency? Explain.
Expert Solution
This question has been solved!
Explore an expertly crafted, step-by-step solution for a thorough understanding of key concepts.

This is a popular solution!

Trending now
This is a popular solution!

Step by step
Solved in 6 steps

Knowledge Booster


Learn more about
Need a deep-dive on the concept behind this application? Look no further. Learn more about this topic, probability and related others by exploring similar questions and additional content below.Recommended textbooks for you
Linear Algebra: A Modern Introduction
Algebra
ISBN:
9781285463247
Author:
David Poole
Publisher:
Cengage Learning

Trigonometry (MindTap Course List)
Trigonometry
ISBN:
9781337278461
Author:
Ron Larson
Publisher:
Cengage Learning
Linear Algebra: A Modern Introduction
Algebra
ISBN:
9781285463247
Author:
David Poole
Publisher:
Cengage Learning
Trigonometry (MindTap Course List)
Trigonometry
ISBN:
9781337278461
Author:
Ron Larson
Publisher:
Cengage Learning