
MATLAB: An Introduction with Applications
6th Edition
ISBN: 9781119256830
Author: Amos Gilat
Publisher: John Wiley & Sons Inc
expand_more
expand_more
format_list_bulleted
Related questions
Question
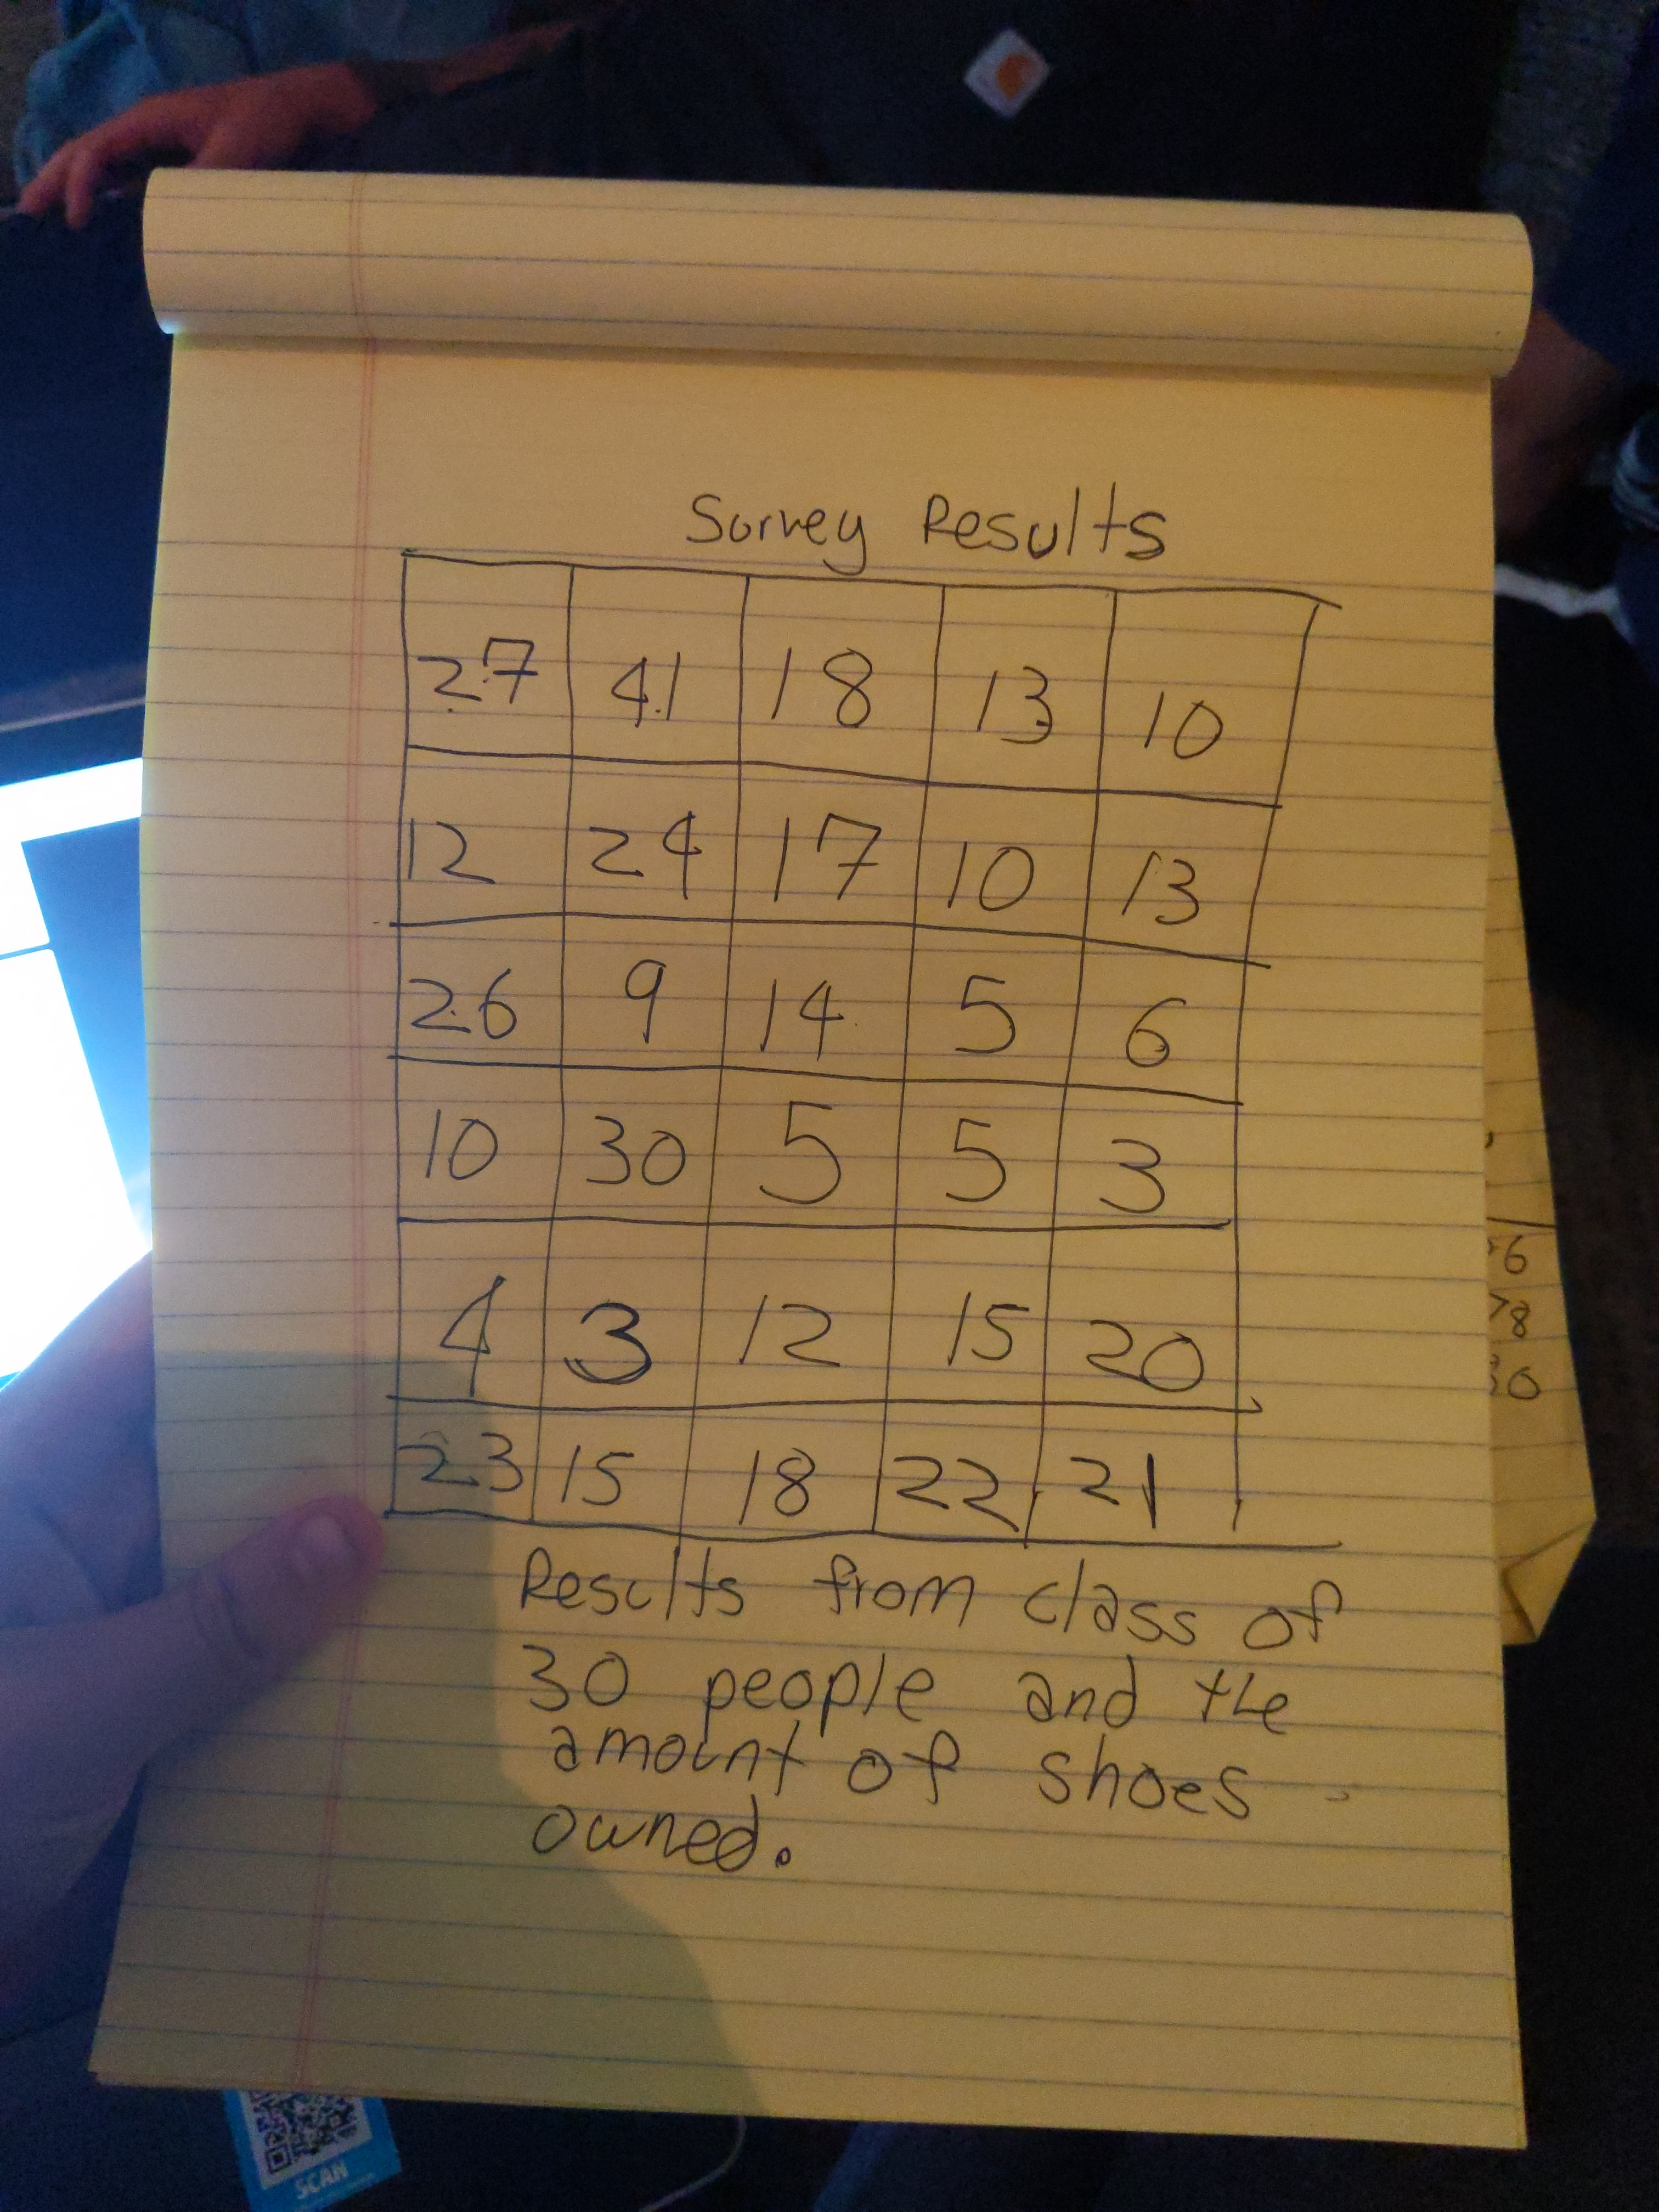
Using the data table provided, construct a frequency table.
A) construct a histogram on a graph of number of pairs of shoes owned(Data is graph). Make 6-8 intervals.
B) calculate x=
Sx=

Expert Solution
This question has been solved!
Explore an expertly crafted, step-by-step solution for a thorough understanding of key concepts.

This is a popular solution

Trending nowThis is a popular solution!

Step by stepSolved in 3 steps with 6 images

Knowledge Booster


Learn more about
Need a deep-dive on the concept behind this application? Look no further. Learn more about this topic, statistics and related others by exploring similar questions and additional content below.Similar questions
- Proc Freq of the SAS System produced a data of 4 different zip codes (zip codes 1-4) that has most homes for sale. Zip code 1 has 6, zip code 2 has 13, zip code 3 has 16, and zip code 4 has 34. Complete the relative frequency distribution. Zip Relative Frequency 1 % 2 % 3 % 4 %arrow_forwardWith the given information, construct a frequency bar graph.arrow_forwardPlease solve and explain #2arrow_forward
- Pls help ASAParrow_forwardHow do I find the number of classes in a frequency histogram.arrow_forward6. Fill in the missing values in the following table of relative frequency, labelled A- J. Show how you calculate each value, and put your final answer for each value in the table below (e.g., replace "A" with your found value). The method you use can be different from mine, but you must show how you arrive at each value. Hint: go in order. Find A, then B, etc. Tutorial video 3 should be very helpful here. Class Frequency Relative frequency Cumulative relative frequency 1 to 5 300 0.15 0.15 6 to 10 B A 0.20 11 to 15 500 C D 16 to 20 F 0.45 E 21 to 25 H G 0.98 26 to 30 J I 1.00arrow_forward
- The state education commission wants to estimate the fraction of tenth grade students that have reading skills at or below the eighth grade level. Suppose a sample of 2552 tenth graders is drawn. Of the students sampled, 2119 read above the eighth grade level. Using the data, estimate the proportion of tenth graders reading at or below the eighth grade level. Enter your answer as a fraction or a decimal number rounded to three decimal places.arrow_forward2.) Explain why the relative frequency column of a frequency table might not sum to 1.0.arrow_forwardA student made a histogram…arrow_forward
- Objective: Students will be able to 1) Create a box-and-whisker plot, 2) Interpret a box-and-whisker plot, and Identify cumulative frequency. How do I interpret a box-and-whisker plot? I 1. What does the x-axis show? Boys 2. What does the y-axis represent? 3. What does the length of Girls each of the lines (red and green) mean? 4. Does the size of the box 2. 8 10 12 14 16 18 20 22 24 Time (s) matter? How to create a box-and-whisker plot: To draw a box-and-whisker plot you need five pieces of information, called the five-number summary: the smallest value, the lower quartile (LQ), the median, the upper quartile (U0) and the largest value. An outlier is a value that is much smaller or much larger than the other values. An outlier is a point less than the LQ-1.5x 1QR or greater than the UQ+1.5xIQR.arrow_forward2. Create a box and whisker plot based on the data below: 12 11 15 12 19 20 19 14 18 15 16arrow_forwardWhich is the line-of-best-fit for the data represented below? Height Weight Tim 67 160 Evan 73 210 Peter 66 167 Kevin 75 220 Carson 68 185 Will 70 180 Jamar 72 185 James 65 146 Find the equation y=mx+b without using a calculator nor excel.arrow_forward
arrow_back_ios
SEE MORE QUESTIONS
arrow_forward_ios
Recommended textbooks for you
- MATLAB: An Introduction with ApplicationsStatisticsISBN:9781119256830Author:Amos GilatPublisher:John Wiley & Sons Inc
 Probability and Statistics for Engineering and th...StatisticsISBN:9781305251809Author:Jay L. DevorePublisher:Cengage Learning
 Statistics for The Behavioral Sciences (MindTap C...StatisticsISBN:9781305504912Author:Frederick J Gravetter, Larry B. WallnauPublisher:Cengage Learning
  Elementary Statistics: Picturing the World (7th E...StatisticsISBN:9780134683416Author:Ron Larson, Betsy FarberPublisher:PEARSON
 The Basic Practice of StatisticsStatisticsISBN:9781319042578Author:David S. Moore, William I. Notz, Michael A. FlignerPublisher:W. H. Freeman
 Introduction to the Practice of StatisticsStatisticsISBN:9781319013387Author:David S. Moore, George P. McCabe, Bruce A. CraigPublisher:W. H. Freeman
MATLAB: An Introduction with Applications
Statistics
ISBN:9781119256830
Author:Amos Gilat
Publisher:John Wiley & Sons Inc
Probability and Statistics for Engineering and th...
Statistics
ISBN:9781305251809
Author:Jay L. Devore
Publisher:Cengage Learning
Statistics for The Behavioral Sciences (MindTap C...
Statistics
ISBN:9781305504912
Author:Frederick J Gravetter, Larry B. Wallnau
Publisher:Cengage Learning
Elementary Statistics: Picturing the World (7th E...
Statistics
ISBN:9780134683416
Author:Ron Larson, Betsy Farber
Publisher:PEARSON
The Basic Practice of Statistics
Statistics
ISBN:9781319042578
Author:David S. Moore, William I. Notz, Michael A. Fligner
Publisher:W. H. Freeman
Introduction to the Practice of Statistics
Statistics
ISBN:9781319013387
Author:David S. Moore, George P. McCabe, Bruce A. Craig
Publisher:W. H. Freeman