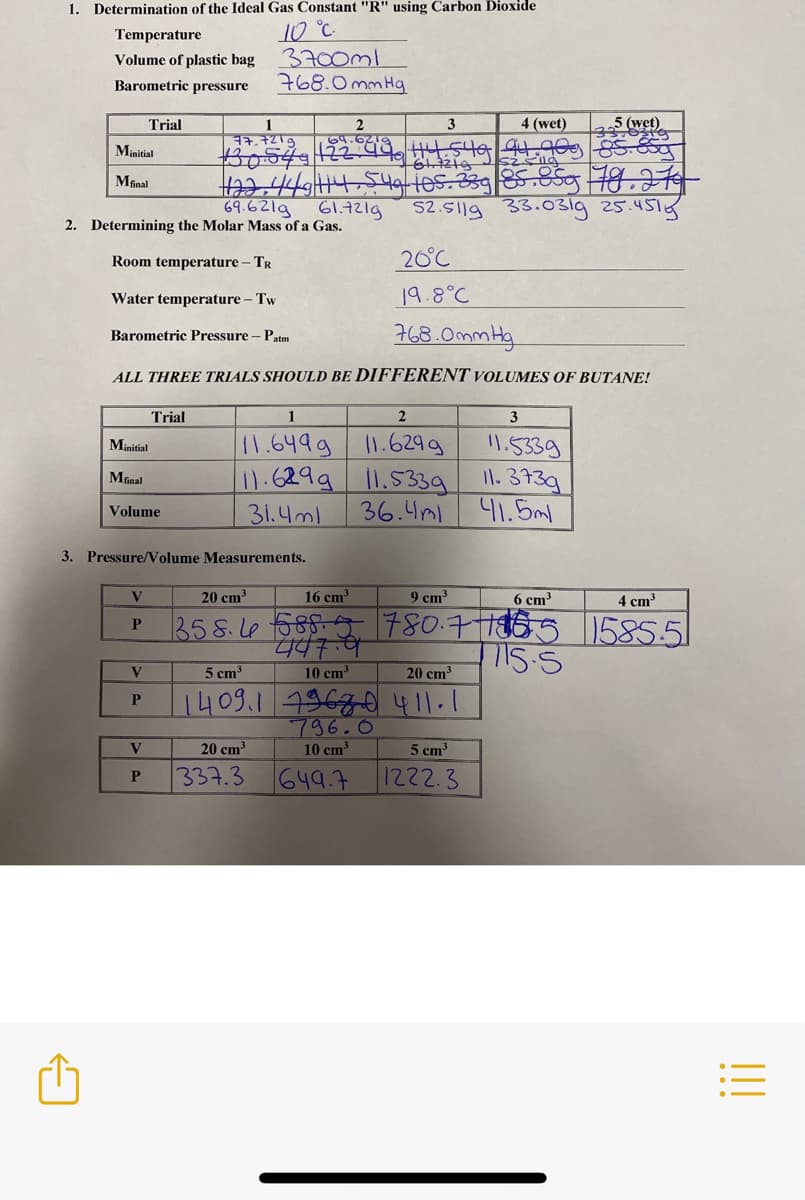
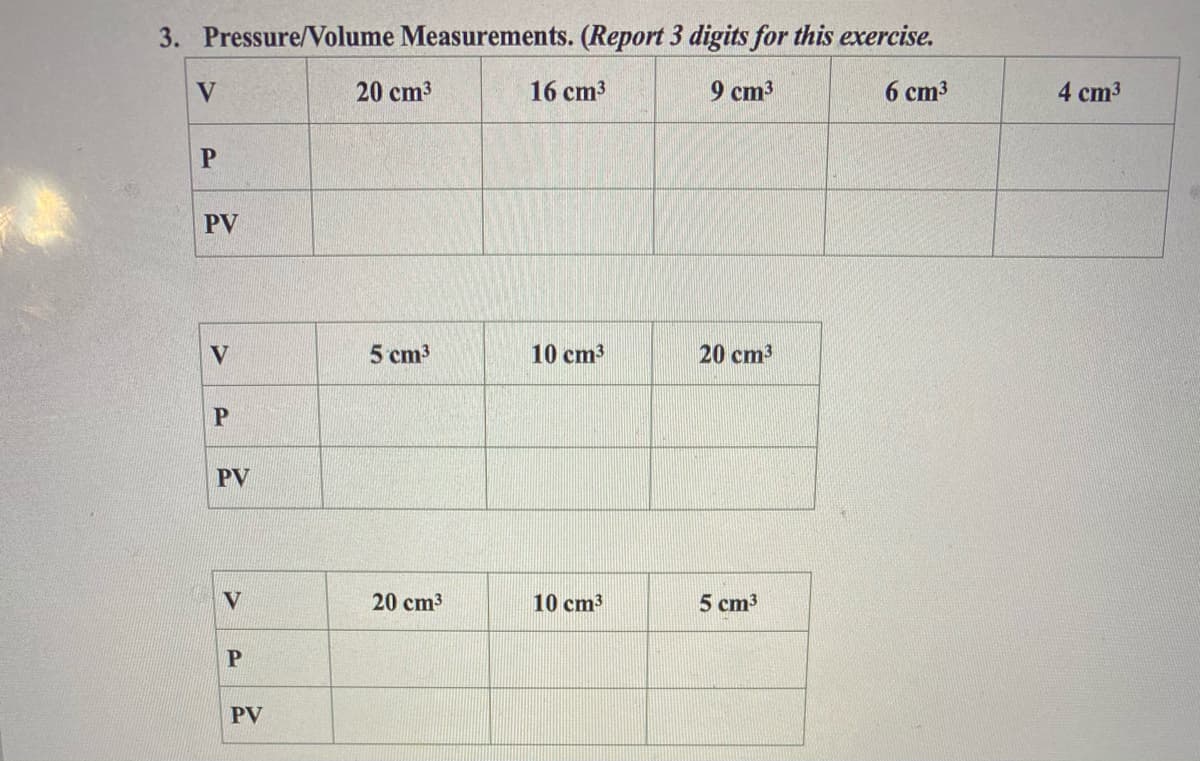
1. Determination of the Ideal Gas Constant "R" using Carbon Dioxide 10 °C Volume of plastic bag 3700ml 768.0mmHq Temperature Barometric pressure Trial 1 2 64.6219 3 4 (wet) 5 (wet) 77.7219 Minitial Msal 69.621g 61.721g 2. Determining the Molar Mass of a Gas. 52.511g 33.03lg 25.451 Room temperature – TR 20°C Water temperature - Tw 19.8°C 768.0mmHg Barometric Pressure - Patm ALL THREE TRIALS SHOULD BE DIFFERENT VOLUMES OF BUTANE! Trial 1 2 3 11.649g 1.629 31.4ml 11.629g 11.5339 Il. 373g 36.4m 41.5ml Minitial 11.5339 Manal Volume 3. Pressure/Volume Measurements. 20 cm 16 cm 9 cm 6 cm 4 cm 780.71865 1585.5 715.5 1358.le f585-9 5 cm 10 cm 20 cm 1409.1 79670411.1 796.0 10 cm 20 cm 5 cm 337.3 649.7 1222.3


Kinetic Theory of Gas
The Kinetic Theory of gases is a classical model of gases, according to which gases are composed of molecules/particles that are in random motion. While undergoing this random motion, kinetic energy in molecules can assume random velocity across all directions. It also says that the constituent particles/molecules undergo elastic collision, which means that the total kinetic energy remains constant before and after the collision. The average kinetic energy of the particles also determines the pressure of the gas.
P-V Diagram
A P-V diagram is a very important tool of the branch of physics known as thermodynamics, which is used to analyze the working and hence the efficiency of thermodynamic engines. As the name suggests, it is used to measure the changes in pressure (P) and volume (V) corresponding to the thermodynamic system under study. The P-V diagram is used as an indicator diagram to control the given thermodynamic system.

Step by step
Solved in 2 steps


