1. Express one decimal place. ment in common-size percentages. Carry computations to Requi Comment briefly on the changes between the two years. 2. EXERCISE 15-2 Financial Ratios for Assessing Liquidity LO15-2 Comparative financial statements for Weller Corporation, a merchandising company, for the year ending December 31 appear below. The company did not issue any new common stock during the year. A total of 800,000 shares of common stock were outstanding. The interest rate on the bond was 12%, the income tax rate was 40%, and the dividend per share of common stock was $0.75 last year and $0.40 this year. The market value of the company's common stock at the end of this year was $18. All of the company's sales are on account. Weller Corporation Comparative Balance Sheet (dollars in thousands) This Year Last Year Assets Current assets: Cash .... $ 1,280 $ 1,560 Accounts receivable, net 12,300 9,100 Inventory .. 9,700 8,200 Prepaid expenses . 1,800 2,100 Total current assets ... 25,080 20,960 Property and equipment: Land 6,000 6,000 Buildings and equipment, net 19,200 19,000 Total property and equipment .. 25,200 25,000 Total assets $50,280 $45,960 Liabilities and Stockholders' Equity Current liabilities: $ 9,500 $ 8,300 Accounts payable .... Accrued liabilities .... 600 700 300 300 Notes payable, short term Total current liabilities .. 10,400 9,300 Long-term liabilities: Bonds payable ..... 5,000 5,000 Total liabilities .... 15,400 14,300 Stockholders' equity: 800 800 Common stock ..... Additional paid-in capital 4,200 4,200 5,000 5,000 Total paid-in capital .... Retained earnings 29,880 26,660 34,880 31,660 Total stockholders' equity. $50,280 $45,960 Total liabilities and stockholders' equity . . ... www Chapter 15 Comparative Income Statement and Reconciliation (dollars in thousands) Weller Corporation Last Year This Year $74,000 $79,000 52,000 48,000 Sales.. 26,000 Cost of goods sold 27,000 Gross margin 8,000 Selling and administrative expenses: Selling expenses ... Administrative expenses ... 8,500 12,000 11,000 20,500 19,000 Total selling and administrative expenses .. 7,000 6,500 Net operating income 600 600 Interest expense . दाहि 5,900 6,400 Net income before taxes .. .. Income taxes .. 2,360 2,560 Net income 3,540 3,840 Dividends to common stockholders 320 600 Net income added to retained earnings .... Beginning retained earnings . 3,220 3,240 26,660 23,420 Ending retained earnings .. $29,880 $26,660 aleea/ Required: Compute the following financial data and ratios for this year: 1. Working capital. 2. Current ratio. 3. Acid-test ratio. EXERCISE 15-3 Financial Ratios for Asset Management LO15-3 Refer to the data in Exercise 15.2 for Woll
1. Express one decimal place. ment in common-size percentages. Carry computations to Requi Comment briefly on the changes between the two years. 2. EXERCISE 15-2 Financial Ratios for Assessing Liquidity LO15-2 Comparative financial statements for Weller Corporation, a merchandising company, for the year ending December 31 appear below. The company did not issue any new common stock during the year. A total of 800,000 shares of common stock were outstanding. The interest rate on the bond was 12%, the income tax rate was 40%, and the dividend per share of common stock was $0.75 last year and $0.40 this year. The market value of the company's common stock at the end of this year was $18. All of the company's sales are on account. Weller Corporation Comparative Balance Sheet (dollars in thousands) This Year Last Year Assets Current assets: Cash .... $ 1,280 $ 1,560 Accounts receivable, net 12,300 9,100 Inventory .. 9,700 8,200 Prepaid expenses . 1,800 2,100 Total current assets ... 25,080 20,960 Property and equipment: Land 6,000 6,000 Buildings and equipment, net 19,200 19,000 Total property and equipment .. 25,200 25,000 Total assets $50,280 $45,960 Liabilities and Stockholders' Equity Current liabilities: $ 9,500 $ 8,300 Accounts payable .... Accrued liabilities .... 600 700 300 300 Notes payable, short term Total current liabilities .. 10,400 9,300 Long-term liabilities: Bonds payable ..... 5,000 5,000 Total liabilities .... 15,400 14,300 Stockholders' equity: 800 800 Common stock ..... Additional paid-in capital 4,200 4,200 5,000 5,000 Total paid-in capital .... Retained earnings 29,880 26,660 34,880 31,660 Total stockholders' equity. $50,280 $45,960 Total liabilities and stockholders' equity . . ... www Chapter 15 Comparative Income Statement and Reconciliation (dollars in thousands) Weller Corporation Last Year This Year $74,000 $79,000 52,000 48,000 Sales.. 26,000 Cost of goods sold 27,000 Gross margin 8,000 Selling and administrative expenses: Selling expenses ... Administrative expenses ... 8,500 12,000 11,000 20,500 19,000 Total selling and administrative expenses .. 7,000 6,500 Net operating income 600 600 Interest expense . दाहि 5,900 6,400 Net income before taxes .. .. Income taxes .. 2,360 2,560 Net income 3,540 3,840 Dividends to common stockholders 320 600 Net income added to retained earnings .... Beginning retained earnings . 3,220 3,240 26,660 23,420 Ending retained earnings .. $29,880 $26,660 aleea/ Required: Compute the following financial data and ratios for this year: 1. Working capital. 2. Current ratio. 3. Acid-test ratio. EXERCISE 15-3 Financial Ratios for Asset Management LO15-3 Refer to the data in Exercise 15.2 for Woll

Financial Accounting
15th Edition
ISBN:9781337272124
Author:Carl Warren, James M. Reeve, Jonathan Duchac
Publisher:Carl Warren, James M. Reeve, Jonathan Duchac
Chapter17: Financial Statement Analysis
Section: Chapter Questions
Problem 20E: Five measures of solvency or profitability The balance sheet for Garcon Inc. at the end of the...

Related questions
Question
Compute the following the financial data for the year.
4. Average sale period
5. Operating cycle
6. Total asset turnover
Transcribed Image Text:1. Express
one decimal place.
ment in common-size percentages. Carry computations to
Requi
Comment briefly on the changes between the two years.
2.
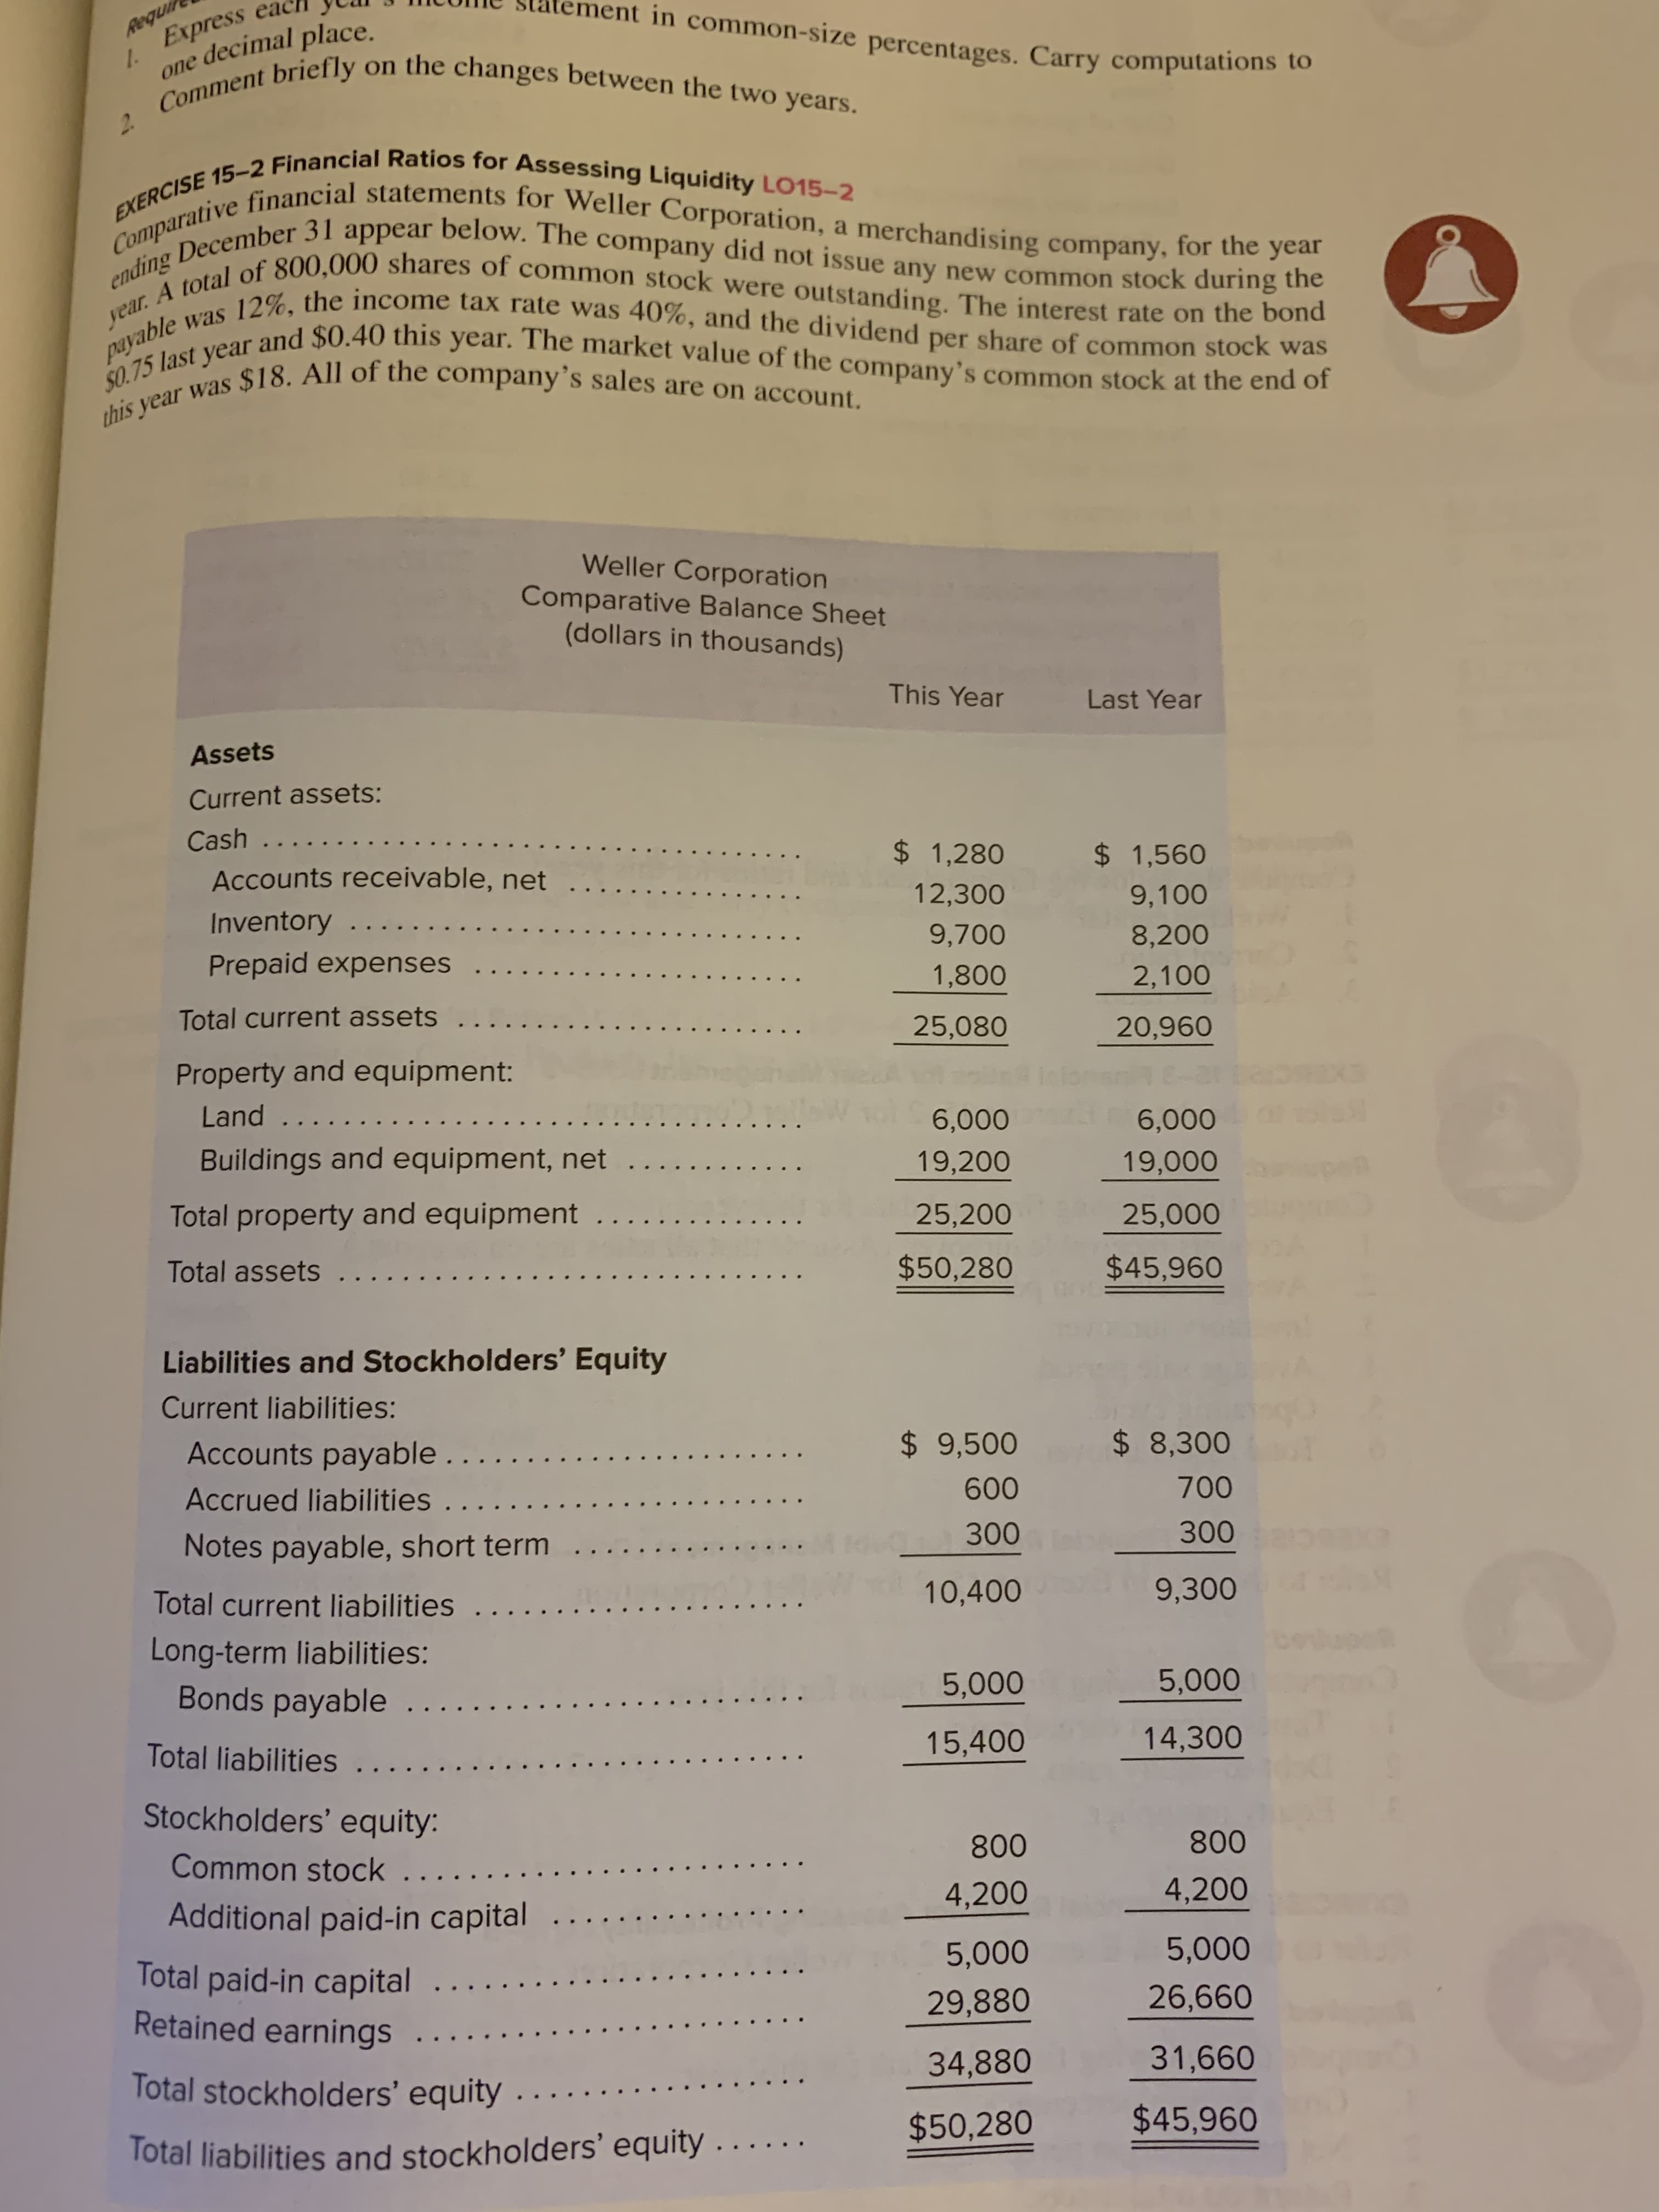
EXERCISE 15-2 Financial Ratios for Assessing Liquidity LO15-2
Comparative financial statements for Weller Corporation, a merchandising company, for the year
ending December 31 appear below. The company did not issue any new common stock during the
year. A total of 800,000 shares of common stock were outstanding. The interest rate on the bond
was 12%, the income tax rate was 40%, and the dividend per share of common stock was
$0.75 last year and $0.40 this year. The market value of the company's common stock at the end of
this year was $18. All of the company's sales are on account.
Weller Corporation
Comparative Balance Sheet
(dollars in thousands)
This Year
Last Year
Assets
Current assets:
Cash ....
$ 1,280
$ 1,560
Accounts receivable, net
12,300
9,100
Inventory ..
9,700
8,200
Prepaid expenses .
1,800
2,100
Total current assets ...
25,080
20,960
Property and equipment:
Land
6,000
6,000
Buildings and equipment, net
19,200
19,000
Total property and equipment ..
25,200
25,000
Total assets
$50,280
$45,960
Liabilities and Stockholders' Equity
Current liabilities:
$ 9,500
$ 8,300
Accounts payable ....
Accrued liabilities ....
600
700
300
300
Notes payable, short term
Total current liabilities ..
10,400
9,300
Long-term liabilities:
Bonds payable .....
5,000
5,000
Total liabilities ....
15,400
14,300
Stockholders' equity:
800
800
Common stock .....
Additional paid-in capital
4,200
4,200
5,000
5,000
Total paid-in capital ....
Retained earnings
29,880
26,660
34,880
31,660
Total stockholders' equity.
$50,280
$45,960
Total liabilities and stockholders' equity . . ...
Transcribed Image Text:www
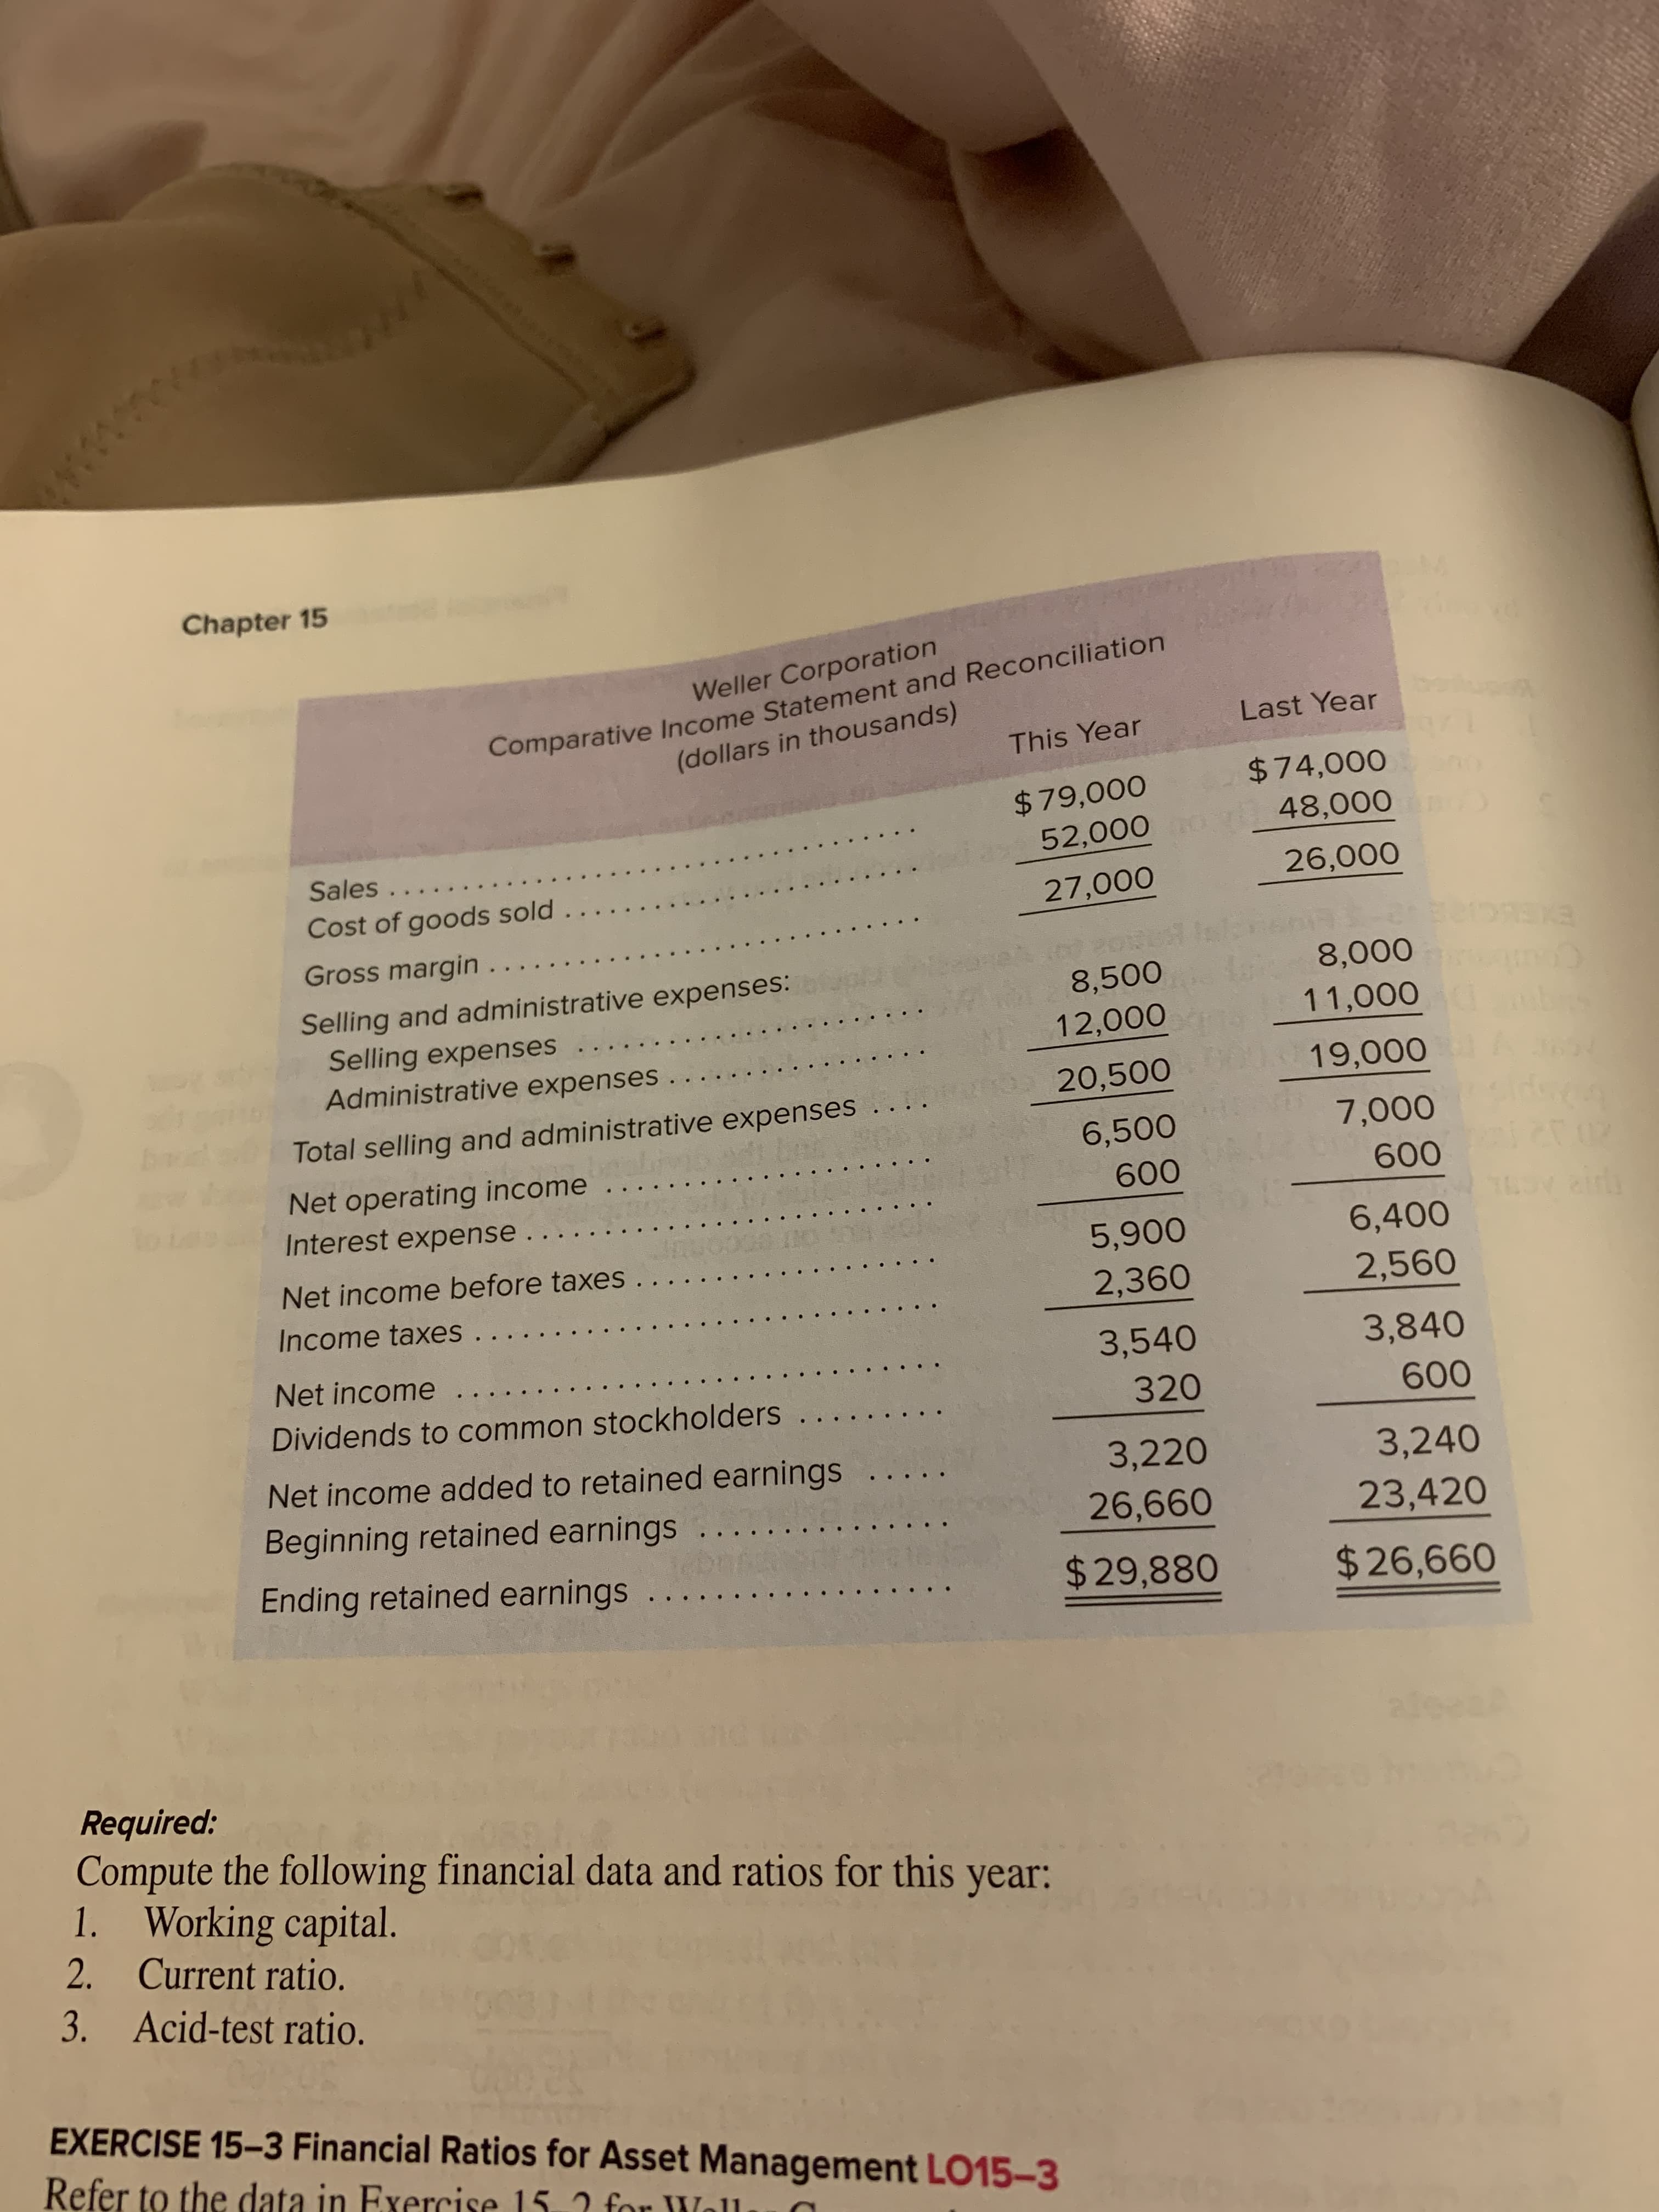
Chapter 15
Comparative Income Statement and Reconciliation
(dollars in thousands)
Weller Corporation
Last Year
This Year
$74,000
$79,000
52,000
48,000
Sales..
26,000
Cost of goods sold
27,000
Gross margin
8,000
Selling and administrative expenses:
Selling expenses ...
Administrative expenses ...
8,500
12,000
11,000
20,500
19,000
Total selling and administrative expenses ..
7,000
6,500
Net operating income
600
600
Interest expense .
दाहि
5,900
6,400
Net income before taxes .. ..
Income taxes ..
2,360
2,560
Net income
3,540
3,840
Dividends to common stockholders
320
600
Net income added to retained earnings ....
Beginning retained earnings .
3,220
3,240
26,660
23,420
Ending retained earnings ..
$29,880
$26,660
aleea/
Required:
Compute the following financial data and ratios for this year:
1. Working capital.
2. Current ratio.
3. Acid-test ratio.
EXERCISE 15-3 Financial Ratios for Asset Management LO15-3
Refer to the data in Exercise 15.2 for Woll
Expert Solution
This question has been solved!
Explore an expertly crafted, step-by-step solution for a thorough understanding of key concepts.

This is a popular solution!

Trending now
This is a popular solution!

Step by step
Solved in 2 steps with 2 images

Knowledge Booster


Learn more about
Need a deep-dive on the concept behind this application? Look no further. Learn more about this topic, accounting and related others by exploring similar questions and additional content below.Recommended textbooks for you
Financial Accounting
Accounting
ISBN:
9781337272124
Author:
Carl Warren, James M. Reeve, Jonathan Duchac
Publisher:
Cengage Learning

Intermediate Accounting: Reporting And Analysis
Accounting
ISBN:
9781337788281
Author:
James M. Wahlen, Jefferson P. Jones, Donald Pagach
Publisher:
Cengage Learning

Managerial Accounting
Accounting
ISBN:
9781337912020
Author:
Carl Warren, Ph.d. Cma William B. Tayler
Publisher:
South-Western College Pub
Financial Accounting
Accounting
ISBN:
9781337272124
Author:
Carl Warren, James M. Reeve, Jonathan Duchac
Publisher:
Cengage Learning
Intermediate Accounting: Reporting And Analysis
Accounting
ISBN:
9781337788281
Author:
James M. Wahlen, Jefferson P. Jones, Donald Pagach
Publisher:
Cengage Learning
Managerial Accounting
Accounting
ISBN:
9781337912020
Author:
Carl Warren, Ph.d. Cma William B. Tayler
Publisher:
South-Western College Pub

Financial And Managerial Accounting
Accounting
ISBN:
9781337902663
Author:
WARREN, Carl S.
Publisher:
Cengage Learning,

Managerial Accounting: The Cornerstone of Busines…
Accounting
ISBN:
9781337115773
Author:
Maryanne M. Mowen, Don R. Hansen, Dan L. Heitger
Publisher:
Cengage Learning

Century 21 Accounting Multicolumn Journal
Accounting
ISBN:
9781337679503
Author:
Gilbertson
Publisher:
Cengage