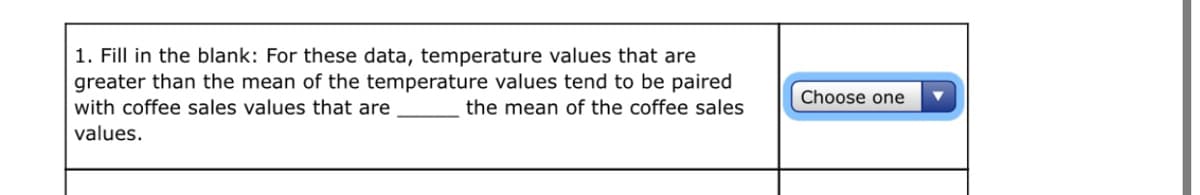
1. Fill in the blank: For these data, temperature values that are greater than the mean of the temperature values tend to be paired the mean of the coffee sales Choose one with coffee sales values that are values.
1. Fill in the blank: For these data, temperature values that are greater than the mean of the temperature values tend to be paired the mean of the coffee sales Choose one with coffee sales values that are values.

Linear Algebra: A Modern Introduction
4th Edition
ISBN:9781285463247
Author:David Poole
Publisher:David Poole
Chapter7: Distance And Approximation
Section7.3: Least Squares Approximation
Problem 31EQ

Related questions

Question
Greater than or less than?
Transcribed Image Text:1. Fill in the blank: For these data, temperature values that are
greater than the mean of the temperature values tend to be paired
with coffee sales values that are
Choose one
the mean of the coffee sales
values.
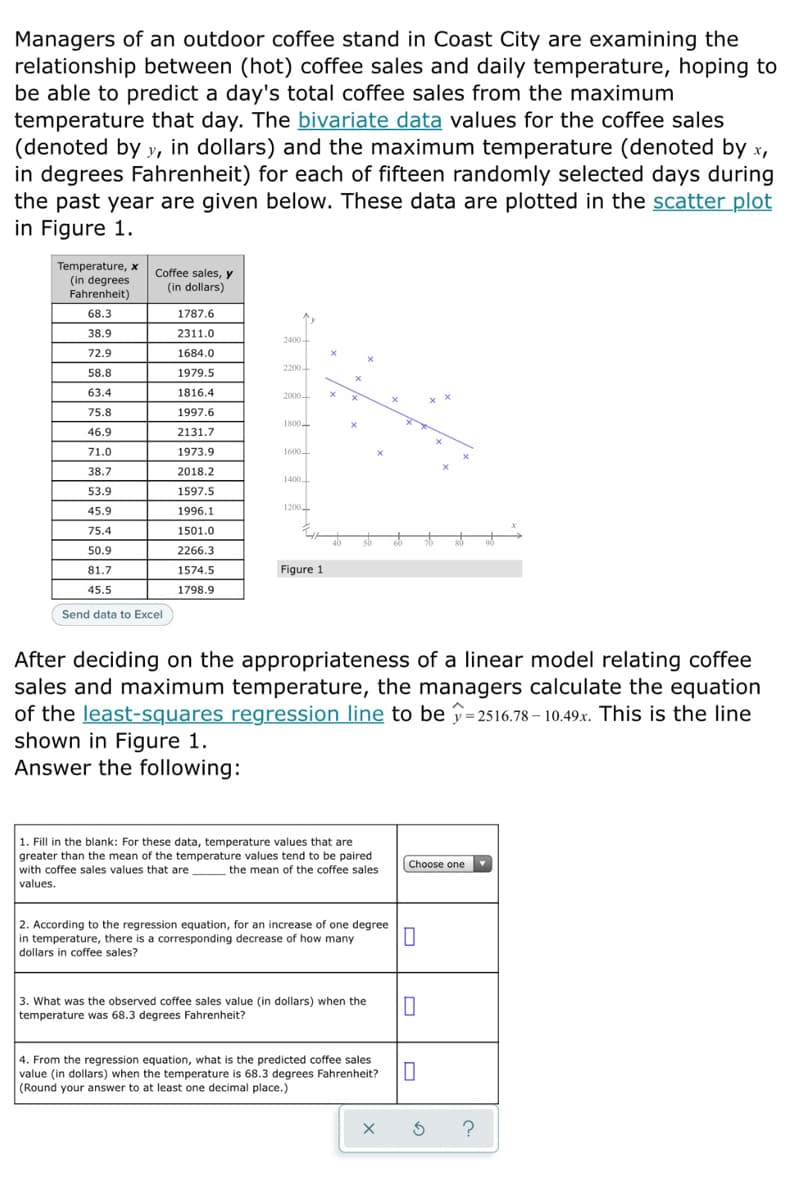
Transcribed Image Text:Managers of an outdoor coffee stand in Coast City are examining the
relationship between (hot) coffee sales and daily temperature, hoping to
be able to predict a day's total coffee sales from the maximum
temperature that day. The bivariate data values for the coffee sales
(denoted by y, in dollars) and the maximum temperature (denoted by x,
in degrees Fahrenheit) for each of fifteen randomly selected days during
the past year are given below. These data are plotted in the scatter plot
in Figure 1.
Temperature, x
(in degrees
Fahrenheit)
Coffee sales, y
(in dollars)
68.3
1787.6
38.9
2311.0
2400
72.9
1684.0
2200
58.8
1979.5
63.4
1816.4
2000-
75.8
1997.6
1800
46.9
2131.7
71.0
1973.9
1600.
38.7
2018.2
1400.
53.9
1597.5
1200
45.9
1996.1
75.4
1501.0
50.9
2266.3
81.7
1574.5
Figure 1
45.5
1798.9
Send data to Excel
After deciding on the appropriateness of a linear model relating coffee
sales and maximum temperature, the managers calculate the equation
of the least-squares regression line to be î=2516.78 – 10.49x. This is the line
shown in Figure 1.
Answer the following:
1. Fill in the blank: For these data, temperature values that are
greater than the mean of the temperature values tend to be paired
with coffee sales values that are
values.
Choose one
the mean of the coffee sales
f one degree
2. According to the regression equation, for an increase
in temperature, there is a corresponding decrease of how many
dollars in coffee sales?
3. What was the observed coffee sales value (in dollars) when the
temperature was 68.3 degrees Fahrenheit?
4. From the regression equation, what is the predicted coffee sales
value (in dollars) when the temperature is 68.3 degrees Fahrenheit?
(Round your answer to at least one decimal place.)
?
Expert Solution
This question has been solved!
Explore an expertly crafted, step-by-step solution for a thorough understanding of key concepts.

Step by step
Solved in 2 steps

Knowledge Booster


Learn more about
Need a deep-dive on the concept behind this application? Look no further. Learn more about this topic, statistics and related others by exploring similar questions and additional content below.Recommended textbooks for you
Linear Algebra: A Modern Introduction
Algebra
ISBN:
9781285463247
Author:
David Poole
Publisher:
Cengage Learning

Glencoe Algebra 1, Student Edition, 9780079039897…
Algebra
ISBN:
9780079039897
Author:
Carter
Publisher:
McGraw Hill
Linear Algebra: A Modern Introduction
Algebra
ISBN:
9781285463247
Author:
David Poole
Publisher:
Cengage Learning
Glencoe Algebra 1, Student Edition, 9780079039897…
Algebra
ISBN:
9780079039897
Author:
Carter
Publisher:
McGraw Hill