1. Find pand 4: In a survey of 80 children, 48 like to watch horror films.
Q: 44 randomly selected students were asked how many siblings were in their family. Let X represent the…
A: We have given the following data Note: According to Bartleby expert guidelines, we can answer only…
Q: The weights of students in a certain school are normally distributed with a mean weight of 66 kg.…
A: We have given that the weights of students is normally distributed with mean weight 66 kg, 10% have…
Q: A musicologist is currently writing a report about pop songs in the late 2010s. As a part of her…
A: For the given data Find Margin of error = ? confidence interval = ?
Q: 64% of adults said that they approved of the death penalty in some circumstances. The newspaper took…
A:
Q: Identify the critical value for this Tukey HSD test: q (k, dfwithin) = %3D Label the normal…
A: From the given data, the number of groups is, k = 3 The total number of observations is, n =…
Q: tike to estimate the average monthly car payment of all IRSC students. From past research, it is…
A: We have given that, Population standard deviation (σ) = $ 49 and margin of error (E) ≤ $ 4.74 and…
Q: For a particular population, a sample of n = 4 scores has an expected value of 10. For the same…
A:
Q: 83, 86, 89, 92, 95 1. How many possible samples can be drawn? (e.g., 5) *
A: Solution-: We have sample data: 83,86,89,92,95
Q: The Indian River County Economic Development Board needs to estimate the proportion of all county…
A:
Q: Find the standardized test statistic t for a sample with n = 10, xbar= 12.7, s = 1.3, and α = 0.05…
A:
Q: 30-33 9 204 Speed (km/hr) Speed kmtr) the correct relative frequency histogram below Relative…
A:
Q: b) The table below shows the ages and glucose levels of 6 indi Glucose Age (x) Level (y) 40 95 23 68…
A: Enter the data into the excel sheet as follows: Click on data>data analysis > regression.…
Q: 29. Find the adjacency matrix for the graph below. * (B
A: Adjacency Matrix: The adjacency matrix is also referred as a connection matrix that connects a…
Q: For items 7-8: The Principal decided that the top 30% of the class with the highest grades in…
A:
Q: If it has been determined that there exists a very strong linear relationship between two variables,…
A: We have the given the following statement about the correlation coefficient.
Q: Create a split stem-and-leaf plot by hand for the values below. Attach your answer as a pdf, jpg, or…
A: The provided information is
Q: Hampton conducts a hypothesis test with Ho: µ = 44 mm and H1: µ> 44 mm at the a = 0.01 level. He…
A: The appropriate conclusion about Hampton's hypothesis is to be inferred using the given p-value…
Q: COVID-19 (novel corona virus) took the world by surprise in late 2019. By early 2020, nearly all…
A: Assume that p as the true population proportion of infected population that is asymptomatic.
Q: b. It has been reported that the average credit card debt for the newly employed is $3350. The…
A:
Q: 33 Given the z value, find the are under the normal curve for the given parameter: To the left of z…
A:
Q: H μ 60, Η : μ; 60 Ο Η: μ - 37, Η : μ# 37 Which, if any, of the following pairs are hypotheses for a…
A: According to guidelines we solve only first question when given questions are different.
Q: A professor believes that, for the introductory art history classes at his university, the mean test…
A: Sample mean (x̅1) = 79.5Sample mean (x̅2) = 80.7Sample size (n1) = 200Sample size (n2) = 250Standard…
Q: (4) Find the p-value for testing Ho: ßj = o versus Ha: ßj * 0 on the output. Using the p-value,…
A:
Q: a. What is the null hypothesis concerning these variables? b. Are the variances equal across the…
A: Hello! As you have posted more than 3 sub parts, we are answering the first 3 sub-parts. In case…
Q: A textile fiber manufacturer is investigating a new drapery yarn, which the company claims has a…
A:
Q: For the following, state whether the events created are mutually exclusive and collectively…
A: In case of a collectively exhaustive events, when the experiment is performed at least one of these…
Q: You will be working with a subset of a Female Reproductive Health Survey (Female RHS) provided in…
A: From the given information, Q404 column represents the length of time they had their lastPap smear.…
Q: A construction company wants to estimate how likely it is that one of the screws they use for their…
A:
Q: Pain medications sometimes come with side effects. One side effect is dizziness. A researcher…
A: We have given data Tordol Placebo Naproxen Tylenol Advil Dizziness 83 32 36 5 8 No…
Q: A random sample of 8 office staffs hired within the previous year was selected from a large…
A: NOTE: As per the guidelines, we are supposed to solve the first three sub parts only. Please repost…
Q: A population consists of the following values 2, 4, 6, 8 and 10. List down all the possible samples…
A: Given that the population contain following values, 2,4,6,8,10 And if we draw a samples of size 3…
Q: ,000 Populati
A: Lower dispersion is considered better than higher dispersion because higher dispersion means that…
Q: A. What kind of distribution does X have? B. What is the probability that the batch contains no…
A: here given, shop receive batch of 1000 cheap laptop probability that laptop has a defective part =…
Q: Giyen othrrise Fale) = {1-e*" otheraise %3D ot Find P( X$!, Ye!) othenrise Find p/X$I) Find P(Y>)…
A:
Q: Given that uL = 81, o = 20, and n = 49 %3D Find the Probability of the following: a) x 85 0.0808
A: GivenMean(μ)=81standard deviation(σ)=20sample size(n)=49
Q: A village of 1400 has 3 cafes: Caffeine, Express, and Joe. The percentages of villagers that eat in…
A: Define the events as follows: C: A villager eats in Caffeine E: A villager eats in Express J: A…
Q: Calculate the critical tt-value(s) for each of the given hypothesis test scenarios below. If…
A: Know that. Degree of freedom =df =n -1
Q: 5. have equal variance. Two random samples are taken from the populations and the following summary…
A:
Q: : Sampling, Frequency Distributions and Graphs / Measures of Central Tendency / Measures of…
A:
Q: Post Hoc Comparisons using Confidence Intervals Groups Primary school 3 15.67 6.33 Junior high…
A:
Q: Suppose one would like to construct a 90% confidence interval for a sample mean, when the population…
A:
Q: A factorial experiment was designed to test for any significant differences in the time needed to…
A: There are 2 categorical variables which are system and language. We have to test whether there is a…
Q: 10 16 10 20 15 9 9. 13 12 9 15 12 17 16 11 16 15 12 10 11 15 14 13 12 Based on the above data,…
A: For the given data Construct distribution table Frequency Table Class Count 9-11 8 12-14 7…
Q: The National Quality Research Center at the University of Michigan provides a quarterly measure of…
A:
Q: Trainers at a dog training facility find want to know how successful their recently updated program…
A: 250 owners with dogs randomly select; n=250 100 says yes if they consider their dog well behaved;…
Q: The accompanying data represent the miles per gallon of a random sample of cars with a…
A: For the given data find the required blanks
Q: QUESTION 19 A researcher is interested in studying older adults in Florida. It is appropriate for…
A: “Since you have asked multiple questions, we will solve the first question for you. If you want any…
Q: INTERPRET the Descriptive Statisti
A: Variable P1: There are 5 observations under the variable P1. The minimum value for P1 is 55.80 The…
Q: The table below shows the weight of 30 grade 10 students. Show your complete solution. I. Weight (in…
A: Solution-: Let, Class interval =Weight (kg) and fi= Number of students We have given following data:…
Q: You want to obtain a sample to estimate a population proportion. Based on previous evidence, you…
A:
with complete solutionplease
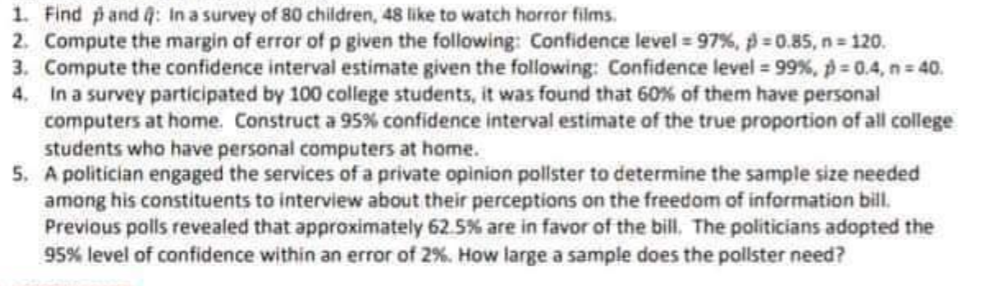
Step by step
Solved in 2 steps
- In exploring possible sites for a convenience store in a large neighbourhood, the retail chain wants to know the proportion of ratepayers in favour of the proposal. If the estimate is required to be within 0.1 of the true proportion, would a random sample of size n = 100 from the council records be sufficient for a 95% confidence interval of this precision?3.Michael wants to make a confidence interval estimate for the proportion of community members in favor of a tax increase for more local school funding. If he wants the margin of error to be no more than 0.025 at a 90% confidence level, a)What is the required sample size required to obtain the desired margin of errorin a study of government financial aid for college students, it becomes necessary to estimate the percentage of full-timecollege students who earn a bachelor's degree in four years or less. Find the sample size needed to estimate that percentage. Use a 0.02 margin of error and use a confidence level of 90%. a. Assume that nothing is known about the percentage to be estimated. (Round up to the nearest integer.)
- Suppose that the sample size had been 240, with x bar=4.1 and s=3.1. Use technology to find a 95% confidence interval. Describe the effect of sample size on the margin of error.2. The National Health Statistics Reports dated Oct. 22, 2008, included the following information on the heights (in.) for non-Hispanic white females: Age Sample Size Sample Mean Std. Error Mean 20-39 866 64.9 .09 60 and older 934 63.1 .11 a. Calculate and interpret a confidence interval at confidence level approximately 95% for the difference between population mean height for the younger women and that for the older women. (answer I found is (1.5214 , 2.0786)) b. Let denote the population mean height for those aged 20-39 and denote the population mean height for those aged 60 and older. Interpret the hypotheses and , and then carry out a test of these hypotheses at significance level .001 using the rejection region approach. (answer I found is = Reject the null hypothesis (p-value is less than the level of significance) c. What is the P-value for the test you carried out in (b)? Based on this P-value, would you reject the null hypothesis at any…After Texas A&M lost again to their rival, the University of Texas, in a football game, the A&M Alumni association decided to conduct a survey to see who wanted to fire the head football coach. Let p represent the proportion of all alumni who favor firing the coach. To guarantee an estimate that is within 0.05 of p at the 95% confidence level, which of the following is the smallest sample size needed? a 269 b 1436 c 385 d 601 e 421
- 2. Compute the margin of error of p given the following: Confidence level 97%, p 0.85, n 120. 3. Compute the confidence interval estimate given the following: Confidence level 99 %, p= 0.4, n 40. 4. In a survey participated by 100 college students, it was found that 60% of them have personal computers at home. Construct a 95% confidence interval estimate of the true proportion of all college students who have personal computers at home. 5. A politician engaged the services of a private opinion pollster to determine the sample size needed among his constituents to interview about their perceptions on the freedom of information bill. Previous polls revealed that approximately 62.5% are in favor of the bill. The politicians adopted the 95% level of confidence within an error of 2%. How large a sample does the pollster need?A soft-drink manufacturer purchases aluminum cans from an outside vendor. A random sample of 70 cans is selected from a large shipment, and each is tested for strength by applying an increasing load to the side of the can until it punctures. Of the 70 cans, 59 meet the specification for puncture resistance. (a) Find a 95% confidence interval for the proportion of cans in the shipment that meet the specification. (b) How to interpret the confidence interval in part (a)? (c) Find the sample size needed for a 90% confidence interval to specify the proportion to within ±0.06. (d) If a 90% confidence interval is computed each day for 300 days, what is the probability that more than 280 of the confidence intervals cover the true proportions?4.) A simple random sample of size n is drawn from a population that is normally distributed. Using the data, it was found to be: x-bar = 108, and s = 10. Construct a 95% confidence interval about μ if the sample size is 25. Construct a 95% confidence interval about μ if the sample size is 10. Compare your results from Parts (a) and (b). How does decreasing the sample size affect the margin of error? Construct a 90% confidence interval about μ if the sample size is 25.
- From a simple random sample of 400 of the 1,395 colleges in our population, it was found that business statistics was a two-semester course in 141 of the sampled colleges. Estimate the proportion of all colleges for which the course is two semesters long, and find a 90% confidence interval.In a previous study, it was found that p hat=.73 for a particular sample. Suppose we would like to repeat this study. Give the sample size n, required to have the margin of error equal to .01, at the 98% confidence level.A national opinion poll found that 44% of all American adults agree that parents should be given vouchers that can be applied toward their children's education at any public or private school of their choice. The result was based on a small sample. A)How large an SRS is required to obtain a margin of error of at most 0.03 in a 99% confidence interval? B) Answer the question in part A again but this time By using Phat=0.5. By how much do the two sample size differ?