1. Find the variance and standard deviation for the five states with the most covered bridges: Oregon: 106 Vermont: 121 Indiana: 152 Ohio: 234 Pennsylvania: 347
1. Find the variance and standard deviation for the five states with the most covered bridges: Oregon: 106 Vermont: 121 Indiana: 152 Ohio: 234 Pennsylvania: 347

MATLAB: An Introduction with Applications
6th Edition
ISBN:9781119256830
Author:Amos Gilat
Publisher:Amos Gilat
Chapter1: Starting With Matlab
Section: Chapter Questions
Problem 1P

Related questions
Question
Do number 1,2,3,4. This is not graded.
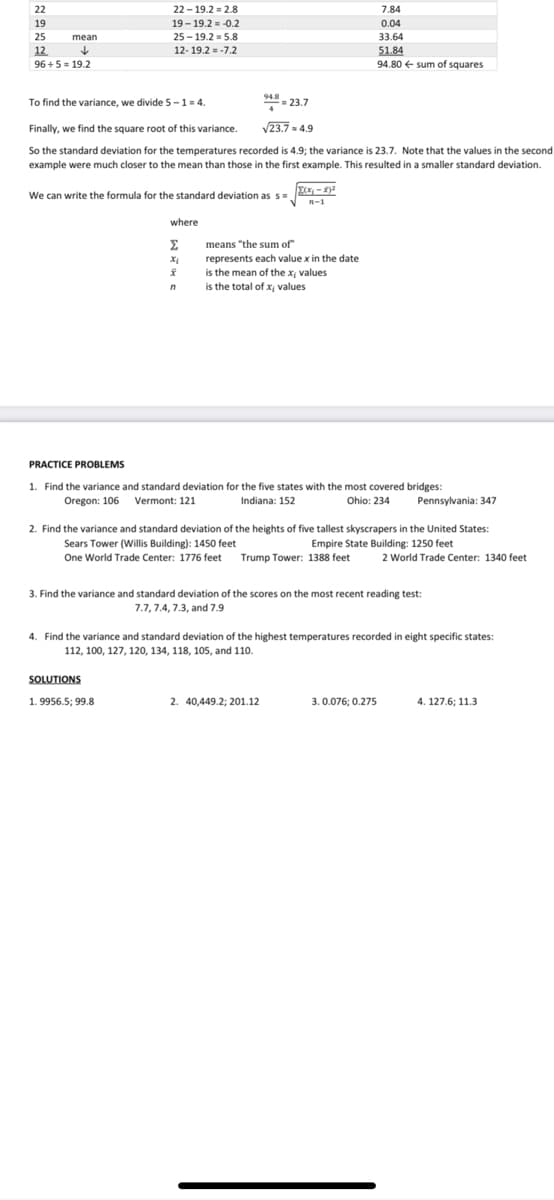
Transcribed Image Text:22
22 - 19.2 = 2.8
7.84
19
19- 19.2 = -0.2
0.04
25 - 19.2 = 5.8
12- 19.2 = -7.2
25
mean
33.64
12
96 +5 = 19.2
51.84
94.80 e sum of squares
94.8
To find the variance, we divide 5-1= 4.
= 23.7
Finally, we find the square root of this variance.
V23.7 = 4.9
So the standard deviation for the temperatures recorded is 4.9; the variance is 23.7. Note that the values in the second
example were much closer to the mean than those in the first example. This resulted in a smaller standard deviation.
We can write the formula for the standard deviation as s=
n-1
where
Σ
means "the sum of"
represents each value x in the date
is the mean of the x values
is the total of x values
PRACTICE PROBLEMS
1. Find the variance and standard deviation for the five states with the most covered bridges:
Oregon: 106 Vermont: 121
Indiana: 152
Ohio: 234
Pennsylvania: 347
2. Find the variance and standard deviation of the heights of five tallest skyscrapers in the United States:
Sears Tower (Willis Building): 1450 feet
Empire State Building: 1250 feet
One World Trade Center: 1776 feet Trump Tower: 1388 feet
2 World Trade Center: 1340 feet
3. Find the variance and standard deviation of the scores on the most recent reading test:
7.7, 7.4, 7.3, and 7.9
4. Find the variance and standard deviation of the highest temperatures recorded in eight specific states:
112, 100, 127, 120, 134, 118, 105, and 110.
SOLUTIONS
1. 9956.5; 99.8
2. 40,449.2; 201.12
3. 0.076; 0.275
4. 127.6; 11.3
Expert Solution
This question has been solved!
Explore an expertly crafted, step-by-step solution for a thorough understanding of key concepts.

This is a popular solution!

Trending now
This is a popular solution!

Step by step
Solved in 2 steps

Recommended textbooks for you
MATLAB: An Introduction with Applications
Statistics
ISBN:
9781119256830
Author:
Amos Gilat
Publisher:
John Wiley & Sons Inc

Probability and Statistics for Engineering and th…
Statistics
ISBN:
9781305251809
Author:
Jay L. Devore
Publisher:
Cengage Learning

Statistics for The Behavioral Sciences (MindTap C…
Statistics
ISBN:
9781305504912
Author:
Frederick J Gravetter, Larry B. Wallnau
Publisher:
Cengage Learning
MATLAB: An Introduction with Applications
Statistics
ISBN:
9781119256830
Author:
Amos Gilat
Publisher:
John Wiley & Sons Inc
Probability and Statistics for Engineering and th…
Statistics
ISBN:
9781305251809
Author:
Jay L. Devore
Publisher:
Cengage Learning
Statistics for The Behavioral Sciences (MindTap C…
Statistics
ISBN:
9781305504912
Author:
Frederick J Gravetter, Larry B. Wallnau
Publisher:
Cengage Learning

Elementary Statistics: Picturing the World (7th E…
Statistics
ISBN:
9780134683416
Author:
Ron Larson, Betsy Farber
Publisher:
PEARSON

The Basic Practice of Statistics
Statistics
ISBN:
9781319042578
Author:
David S. Moore, William I. Notz, Michael A. Fligner
Publisher:
W. H. Freeman

Introduction to the Practice of Statistics
Statistics
ISBN:
9781319013387
Author:
David S. Moore, George P. McCabe, Bruce A. Craig
Publisher:
W. H. Freeman