1. For each set of data: Compute the following: a.) mean, median, and mode. b.) Compute the variance, standard deviation, range, coefficient of variation. c.) Compare the results of (a) through (b) to the miles per gallon of 2020 small SUVS from those 2020 family sedans. Data Set 1: The file contains the overall miles per gallon (MPG) of 2020 small SUVS: 24 23 22 21 22 22 18 18 26 26 26 19 19 19 21 21 21 21 21 18 19 21 22 22 16 16 Data Set 2: The file contains the overall miles per gallon (MPG) of 2020 family sedans: 24 21 22 23 24 34 34 34 20 20 22 22 44 32 20 20 22 20 39 20
1. For each set of data: Compute the following: a.) mean, median, and mode. b.) Compute the variance, standard deviation, range, coefficient of variation. c.) Compare the results of (a) through (b) to the miles per gallon of 2020 small SUVS from those 2020 family sedans. Data Set 1: The file contains the overall miles per gallon (MPG) of 2020 small SUVS: 24 23 22 21 22 22 18 18 26 26 26 19 19 19 21 21 21 21 21 18 19 21 22 22 16 16 Data Set 2: The file contains the overall miles per gallon (MPG) of 2020 family sedans: 24 21 22 23 24 34 34 34 20 20 22 22 44 32 20 20 22 20 39 20

Glencoe Algebra 1, Student Edition, 9780079039897, 0079039898, 2018
18th Edition
ISBN:9780079039897
Author:Carter
Publisher:Carter
Chapter10: Statistics
Section: Chapter Questions
Problem 8PT

Related questions
Question
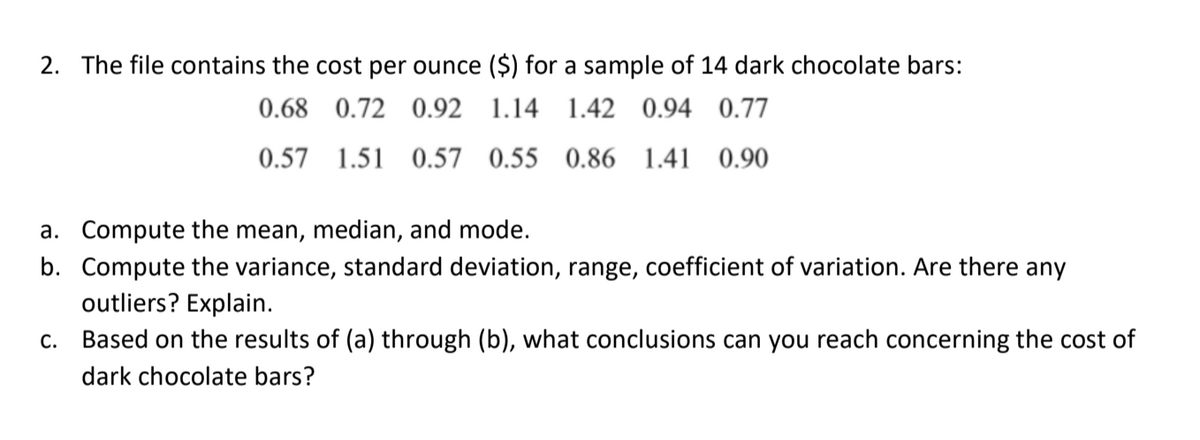
Transcribed Image Text:2. The file contains the cost per ounce ($) for a sample of 14 dark chocolate bars:
0.68 0.72 0.92 1.14 1.42 0.94 0.77
0.57 1.51 0.57 0.55 0.86 1.41 0.90
a. Compute the mean, median, and mode.
b. Compute the variance, standard deviation, range, coefficient of variation. Are there any
outliers? Explain.
c. Based on the results of (a) through (b), what conclusions can you reach concerning the cost of
dark chocolate bars?
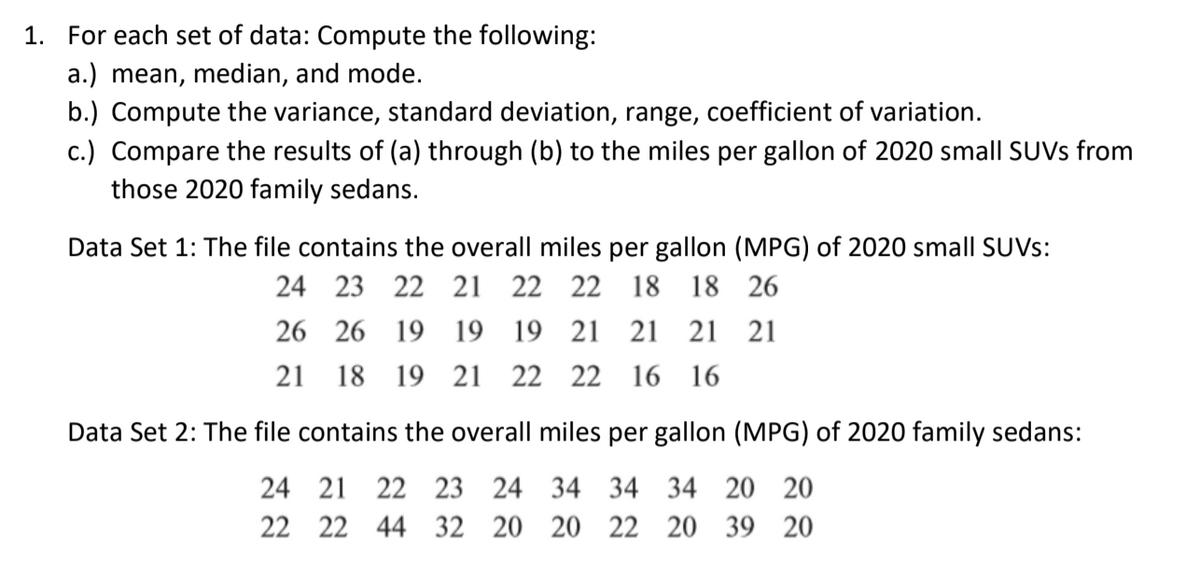
Transcribed Image Text:1. For each set of data: Compute the following:
a.) mean, median, and mode.
b.) Compute the variance, standard deviation, range, coefficient of variation.
c.) Compare the results of (a) through (b) to the miles per gallon of 2020 small SUVS from
those 2020 family sedans.
Data Set 1: The file contains the overall miles per gallon (MPG) of 2020 small SUVS:
24 23 22 21 22 22
18 18 26
26 26 19 19 19 21 21 21 21
21 18 19 21 22 22
16 16
Data Set 2: The file co
the over
miles per gallon (MPG) of 2020 family sedans:
24 21 22 23 24 34 34 34 20 20
22 22 44 32 20 20 22 20 39 20
Expert Solution
This question has been solved!
Explore an expertly crafted, step-by-step solution for a thorough understanding of key concepts.

Step by step
Solved in 4 steps

Recommended textbooks for you
Glencoe Algebra 1, Student Edition, 9780079039897…
Algebra
ISBN:
9780079039897
Author:
Carter
Publisher:
McGraw Hill
Glencoe Algebra 1, Student Edition, 9780079039897…
Algebra
ISBN:
9780079039897
Author:
Carter
Publisher:
McGraw Hill