aisgin, Calculate Quartile Deviation and its Coefficient from the following data : Weight (in pounds) 120 126 130 140 150 160 122 124 No. of Students 3 1 1 3 10 Solution
aisgin, Calculate Quartile Deviation and its Coefficient from the following data : Weight (in pounds) 120 126 130 140 150 160 122 124 No. of Students 3 1 1 3 10 Solution

Glencoe Algebra 1, Student Edition, 9780079039897, 0079039898, 2018
18th Edition
ISBN:9780079039897
Author:Carter
Publisher:Carter
Chapter10: Statistics
Section10.5: Comparing Sets Of Data
Problem 14PPS

Related questions
Question
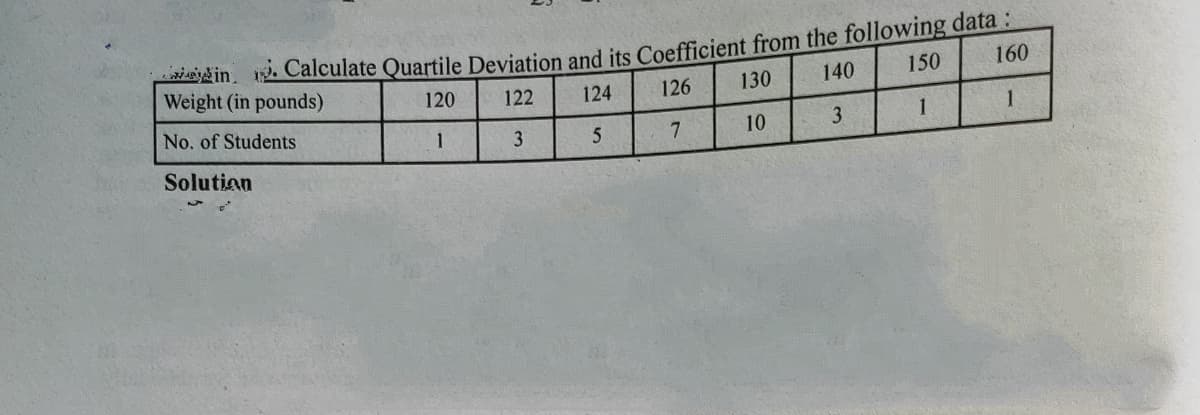
Transcribed Image Text:sisin, 2 Calculate Quartile Deviation and its Coefficient from the following data :
Weight (in pounds)
140
150
160
120
122
124
126
130
No, of Students
1
1
3.
10
Solutian
Expert Solution
This question has been solved!
Explore an expertly crafted, step-by-step solution for a thorough understanding of key concepts.

Step by step
Solved in 2 steps with 2 images

Recommended textbooks for you
Glencoe Algebra 1, Student Edition, 9780079039897…
Algebra
ISBN:
9780079039897
Author:
Carter
Publisher:
McGraw Hill
Glencoe Algebra 1, Student Edition, 9780079039897…
Algebra
ISBN:
9780079039897
Author:
Carter
Publisher:
McGraw Hill