1. Heights Heights of adult males are normally distributed. If a large sample of heights adult males is randomly selected and the heights are illustrated in a histogram, what is the shape of that histogram? kisin
1. Heights Heights of adult males are normally distributed. If a large sample of heights adult males is randomly selected and the heights are illustrated in a histogram, what is the shape of that histogram? kisin

Glencoe Algebra 1, Student Edition, 9780079039897, 0079039898, 2018
18th Edition
ISBN:9780079039897
Author:Carter
Publisher:Carter
Chapter10: Statistics
Section10.3: Measures Of Spread
Problem 1GP

Related questions
Question
Transcribed Image Text:jl. Histogram
Access tech supplements, videos, and data sets at www.TriolaStats.com
Excel
It is extremely difficult to generate histograms in Excel; the XLSTAT add-in should be used:
1. Select the XLSTAT tab in the Ribbon.
2. Click the Visualizing Data button.
3. Select Histograms from the dropdown menu.
Tip: To customize, enter the desired class boundaries in a column, select the Options tab, click
User Defined, and enter the range of cells containing the boundaries in the box.
2-2 Basic Skills and Concepts
Statistical Literacy and Critical Thinking
190108.tt
1. Heights Heights of adult males are normally distributed. If a large sample of heights of
adult males is randomly selected and the heights are illustrated in a histogram, what is the
shape of that histogram?
2. More Heights The population of heights of adult males is normally distributed. If we obtain
a voluntary response sample of 5000 of those heights, will a histogram of the sample heights
be bell-shaped?
3. Blood Platelet Counts Listed below are blood platelet counts (1000 cells/μL) randomly
selected from adults in the United States. Why does it not make sense to construct a histogram
for this data set?
4. Enter the range of cells containing the
Sample labels if the first cell contains.
5. Click OK to generate a default histogr
191 286 263 193 193 215 162 646 250 386
4. Blood Platelet Counts If we collect a sample of blood platelet counts much larger than
the sample included with Exercise 3, and if our sample includes a single outlier, how will that
outlier appear in a histogram?
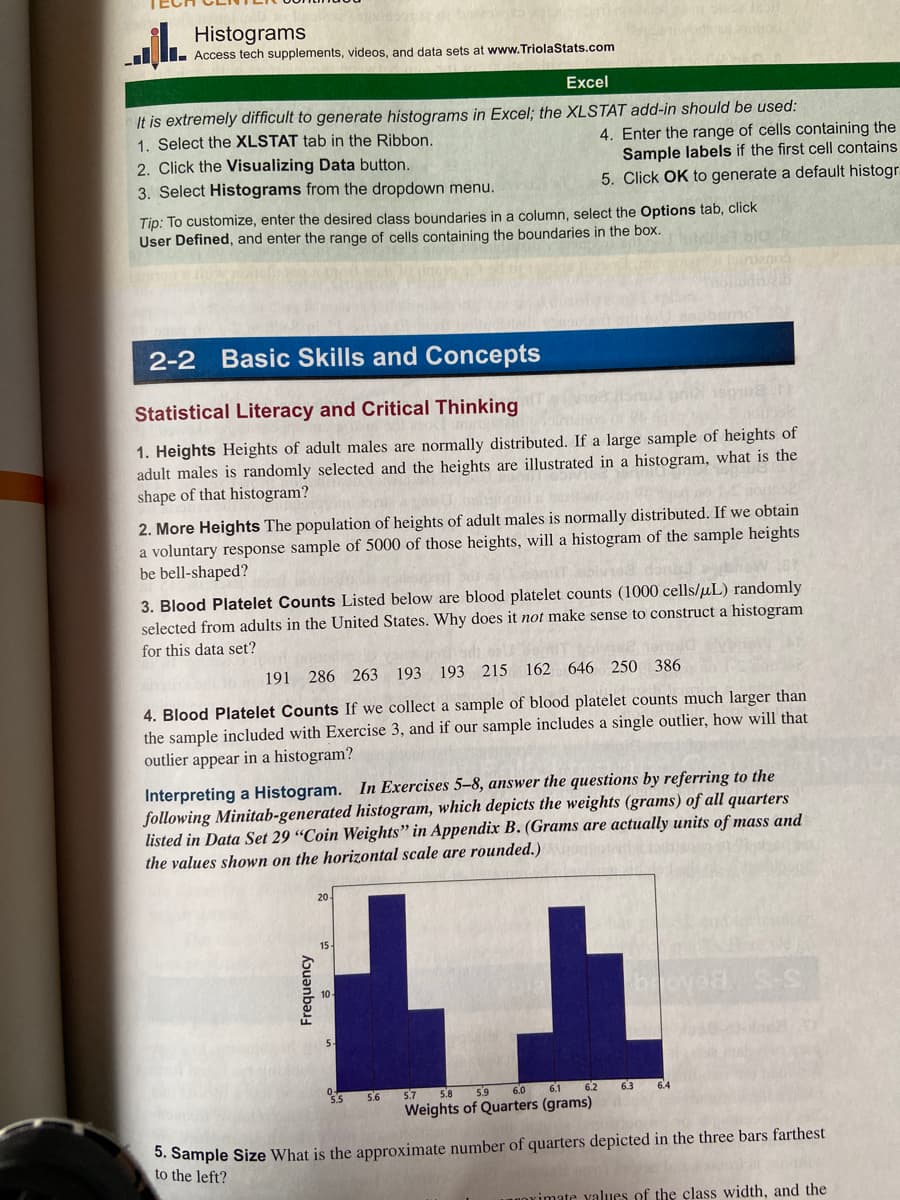
Interpreting a Histogram. In Exercises 5-8, answer the questions by referring to the
following Minitab-generated histogram, which depicts the weights (grams) of all quarters
listed in Data Set 29 "Coin Weights" in Appendix B. (Grams are actually units of mass and
the values shown on the horizontal scale are rounded.)moterti
Frequency
15.
55
5.6
L
6.2
5.7 5.8
5.9
6.0
6.1
Weights of Quarters (grams)
broyed
6.3
64
5. Sample Size What is the approximate number of quarters depicted in the three bars farthest
to the left?
ximate values of the class width, and the
Expert Solution
This question has been solved!
Explore an expertly crafted, step-by-step solution for a thorough understanding of key concepts.

Step by step
Solved in 2 steps

Recommended textbooks for you
Glencoe Algebra 1, Student Edition, 9780079039897…
Algebra
ISBN:
9780079039897
Author:
Carter
Publisher:
McGraw Hill

Holt Mcdougal Larson Pre-algebra: Student Edition…
Algebra
ISBN:
9780547587776
Author:
HOLT MCDOUGAL
Publisher:
HOLT MCDOUGAL

Big Ideas Math A Bridge To Success Algebra 1: Stu…
Algebra
ISBN:
9781680331141
Author:
HOUGHTON MIFFLIN HARCOURT
Publisher:
Houghton Mifflin Harcourt
Glencoe Algebra 1, Student Edition, 9780079039897…
Algebra
ISBN:
9780079039897
Author:
Carter
Publisher:
McGraw Hill
Holt Mcdougal Larson Pre-algebra: Student Edition…
Algebra
ISBN:
9780547587776
Author:
HOLT MCDOUGAL
Publisher:
HOLT MCDOUGAL
Big Ideas Math A Bridge To Success Algebra 1: Stu…
Algebra
ISBN:
9781680331141
Author:
HOUGHTON MIFFLIN HARCOURT
Publisher:
Houghton Mifflin Harcourt