← Use the central limit theorem to find the mean and standard error of the mean of the indicated sampling distribution. Then sketch a graph of the sampling distribution. The per capita consumption of red meat by people in a country in a recent year was normally distributed, witl mean of 110 pounds and a standard deviation of 38.6 pounds. Random samples of size 18 are drawn from t population and the mean of each sample is determined. o=(Round to three decimal places as needed.) Sketch a graph of the sampling distribution. Choose the correct graph below. O A. OC. 87.7 110 127 3 ✓ ✓ [4 OB. 100 0 01 *** 110 1 3000 01 LASER E 320 1 OD. 012 110 128.2 e O L
← Use the central limit theorem to find the mean and standard error of the mean of the indicated sampling distribution. Then sketch a graph of the sampling distribution. The per capita consumption of red meat by people in a country in a recent year was normally distributed, witl mean of 110 pounds and a standard deviation of 38.6 pounds. Random samples of size 18 are drawn from t population and the mean of each sample is determined. o=(Round to three decimal places as needed.) Sketch a graph of the sampling distribution. Choose the correct graph below. O A. OC. 87.7 110 127 3 ✓ ✓ [4 OB. 100 0 01 *** 110 1 3000 01 LASER E 320 1 OD. 012 110 128.2 e O L

Glencoe Algebra 1, Student Edition, 9780079039897, 0079039898, 2018
18th Edition
ISBN:9780079039897
Author:Carter
Publisher:Carter
Chapter10: Statistics
Section10.3: Measures Of Spread
Problem 26PFA

Related questions
Question
Transcribed Image Text:←
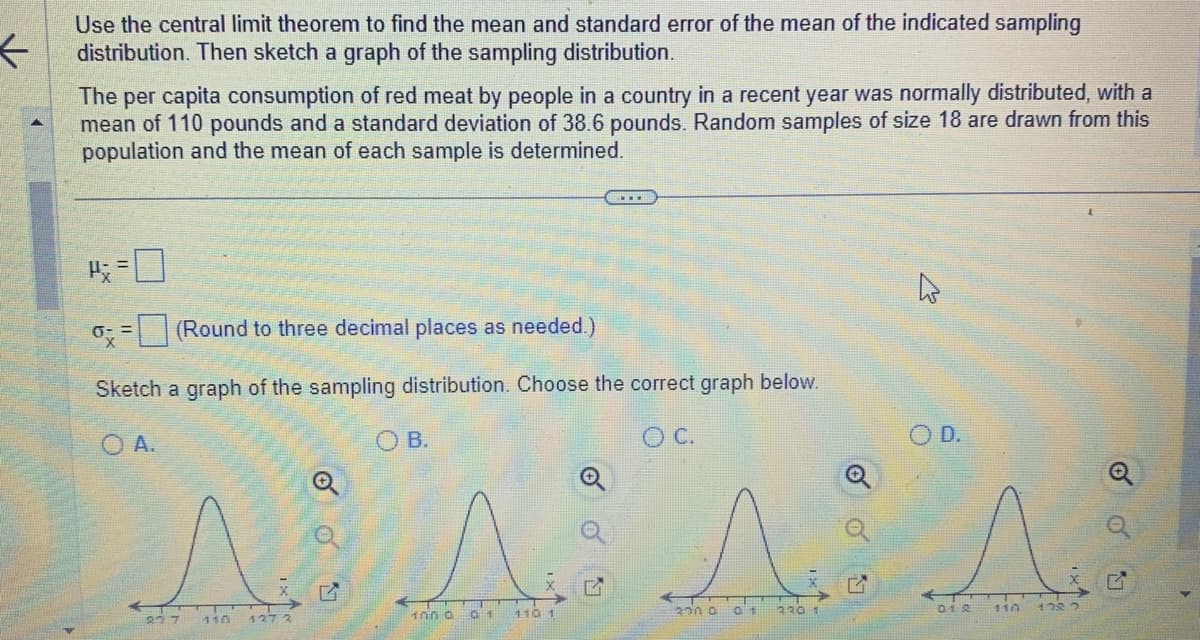
Use the central limit theorem to find the mean and standard error of the mean of the indicated sampling
distribution. Then sketch a graph of the sampling distribution.
The per capita consumption of red meat by people in a country in a recent year was normally distributed, with a
mean of 110 pounds and a standard deviation of 38.6 pounds. Random samples of size 18 are drawn from this
population and the mean of each sample is determined.
P=0
o= (Round to three decimal places as needed.)
Sketch a graph of the sampling distribution. Choose the correct graph below.
O A.
O C.
27 7
1272
ㅇㅇ
14
OB.
1000
01
110 1
A
01
320 0
320 1
01 2
110
128.2
Q
Transcribed Image Text:K
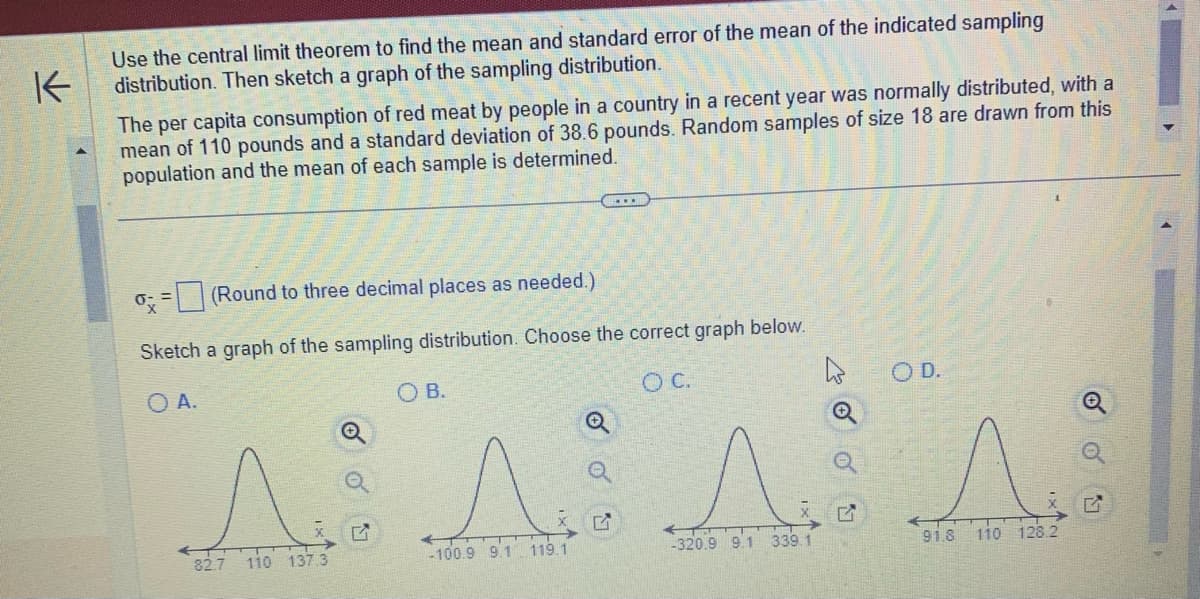
Use the central limit theorem to find the mean and standard error of the mean of the indicated sampling
distribution. Then sketch a graph of the sampling distribution.
The per capita consumption of red meat by people in a country in a recent year was normally distributed, with a
mean of 110 pounds and a standard deviation of 38.6 pounds. Random samples of size 18 are drawn from this
population and the mean of each sample is determined.
ox
(Round to three decimal places as needed.)
Sketch a graph of the sampling distribution. Choose the correct graph below.
O A.
O. C.
Q
OB.
^ ^ ^
82.7 110 137.3
-100.9 9.1 119.1
-320.9 9.1 339.1
G
OD.
s
91.8
110 128.2
4
Expert Solution
This question has been solved!
Explore an expertly crafted, step-by-step solution for a thorough understanding of key concepts.

This is a popular solution!

Trending now
This is a popular solution!

Step by step
Solved in 2 steps with 1 images

Recommended textbooks for you
Glencoe Algebra 1, Student Edition, 9780079039897…
Algebra
ISBN:
9780079039897
Author:
Carter
Publisher:
McGraw Hill
Glencoe Algebra 1, Student Edition, 9780079039897…
Algebra
ISBN:
9780079039897
Author:
Carter
Publisher:
McGraw Hill