1. It is a rule or method that leads to decision to accept or reject the hypothesis when sample values are gathered from the population under study. A. Estimation C. Hypothesis Testing D. Test Statistic B. Hypothesis 2. What mathematical model is appropriate for decision-making about population proportion? A. Graphical representation C. z- statistic B. Normal curve D. None of these 3. This refers to an intelligent guess, an assumption, or a claim about a population parameter which may either be true or false. A. Hypothesis B. Test statistic C. Decision D. Interpretation
1. It is a rule or method that leads to decision to accept or reject the hypothesis when sample values are gathered from the population under study. A. Estimation C. Hypothesis Testing D. Test Statistic B. Hypothesis 2. What mathematical model is appropriate for decision-making about population proportion? A. Graphical representation C. z- statistic B. Normal curve D. None of these 3. This refers to an intelligent guess, an assumption, or a claim about a population parameter which may either be true or false. A. Hypothesis B. Test statistic C. Decision D. Interpretation

Glencoe Algebra 1, Student Edition, 9780079039897, 0079039898, 2018
18th Edition
ISBN:9780079039897
Author:Carter
Publisher:Carter
Chapter4: Equations Of Linear Functions
Section: Chapter Questions
Problem 8SGR

Related questions
Question
100%
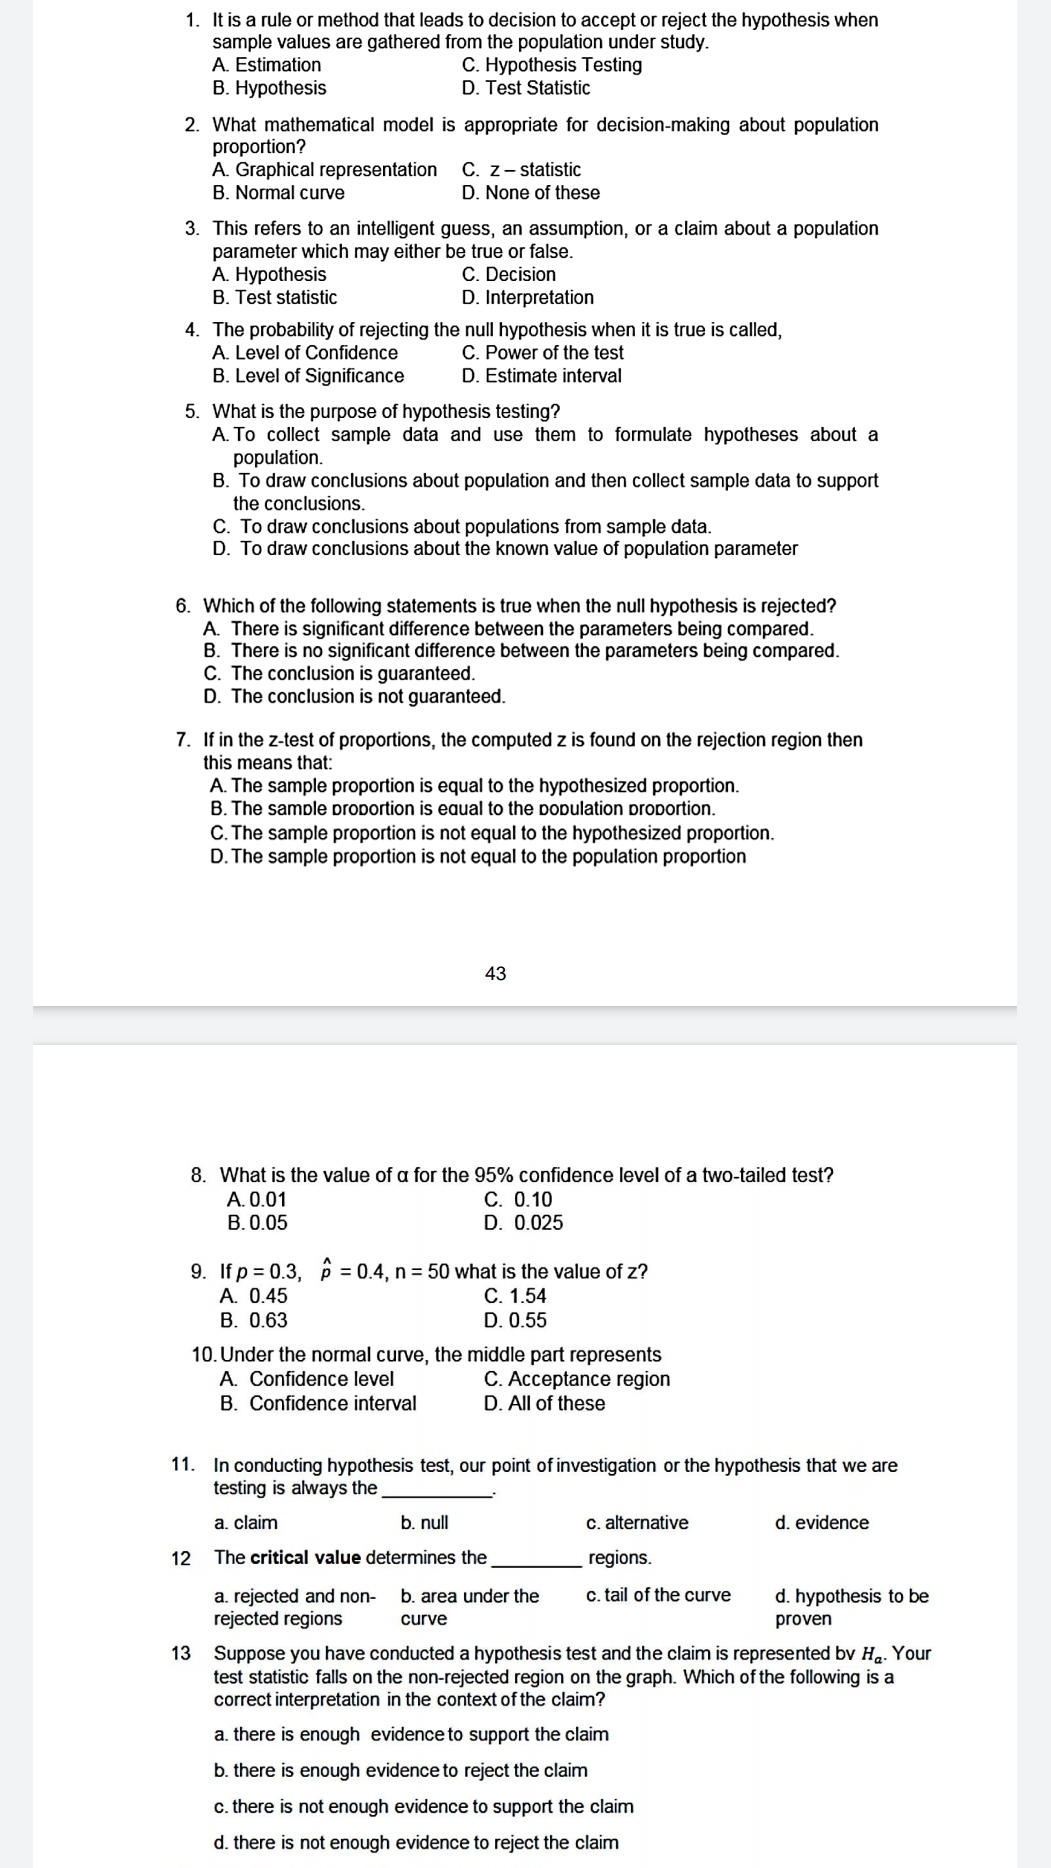
Transcribed Image Text:1. It is a rule or method that leads to decision to accept or reject the hypothesis when
sample values are gathered from the population under study.
A. Estimation
C. Hypothesis Testing
D. Test Statistic
В. Нурothesis
2. What mathematical model is appropriate for decision-making about population
proportion?
A. Graphical representation
B. Normal curve
C. z- statistic
D. None of these
3. This refers to an intelligent guess, an assumption, or a claim about a population
parameter which may either be true or false.
A. Hypothesis
B. Test statistic
C. Decision
D. Interpretation
4. The probability of rejecting the null hypothesis when it is true is called,
A. Level of Confidence
C. Power of the test
D. Estimate interval
B. Level of Significance
5. What is the purpose of hypothesis testing?
A. To collect sample data and use them to formulate hypotheses about a
population.
B. To draw conclusions about population and then collect sample data to support
the conclusions.
C. To draw conclusions about populations from sample data.
D. To draw conclusions about the known value of population parameter
6. Which of the following statements is true when the null hypothesis is rejected?
A. There is significant difference between the parameters being compared.
B. There is no significant difference between the parameters being compared.
C. The conclusion is guaranteed.
D. The conclusion is not guaranteed.
7. If in the z-test of proportions, the computed z is found on the rejection region then
this means that:
A. The sample proportion is equal to the hypothesized proportion.
B. The sample proportion is eaual to the population proportion.
C. The sample proportion is not equal to the hypothesized proportion.
D. The sample proportion is not equal to the population proportion
43
8. What is the value of a for the 95% confidence level of a two-tailed test?
A. 0.01
С. 0.10
B. 0.05
D. 0.025
9. If p = 0.3, p = 0.4, n = 50 what is the value of z?
A. 0.45
В. 0.63
С. 1.54
D. 0.55
10. Under the normal curve, the middle part represents
A. Confidence level
B. Confidence interval
C. Acceptance region
D. All of these
11. In conducting hypothesis test, our point of investigation or the hypothesis that we are
testing is always the
a. claim
b. null
c. alternative
d. evidence
12
The critical value determines the
regions.
a. rejected and non-
rejected regions
c. tail of the curve
d. hypothesis to be
b. area under the
curve
proven
13 Suppose you have conducted a hypothesis test and the claim is represented bv H.. Your
test statistic falls on the non-rejected region on the graph. Which of the following is a
correct interpretation in the context of the claim?
a. there is enough evidence to support the claim
b. there is enough evidence to reject the claim
c. there is not enough evidence to support the claim
d. there is not enough evidence to reject the claim
Expert Solution
This question has been solved!
Explore an expertly crafted, step-by-step solution for a thorough understanding of key concepts.

This is a popular solution!

Trending now
This is a popular solution!

Step by step
Solved in 4 steps

Knowledge Booster


Learn more about
Need a deep-dive on the concept behind this application? Look no further. Learn more about this topic, statistics and related others by exploring similar questions and additional content below.Recommended textbooks for you
Glencoe Algebra 1, Student Edition, 9780079039897…
Algebra
ISBN:
9780079039897
Author:
Carter
Publisher:
McGraw Hill
Glencoe Algebra 1, Student Edition, 9780079039897…
Algebra
ISBN:
9780079039897
Author:
Carter
Publisher:
McGraw Hill