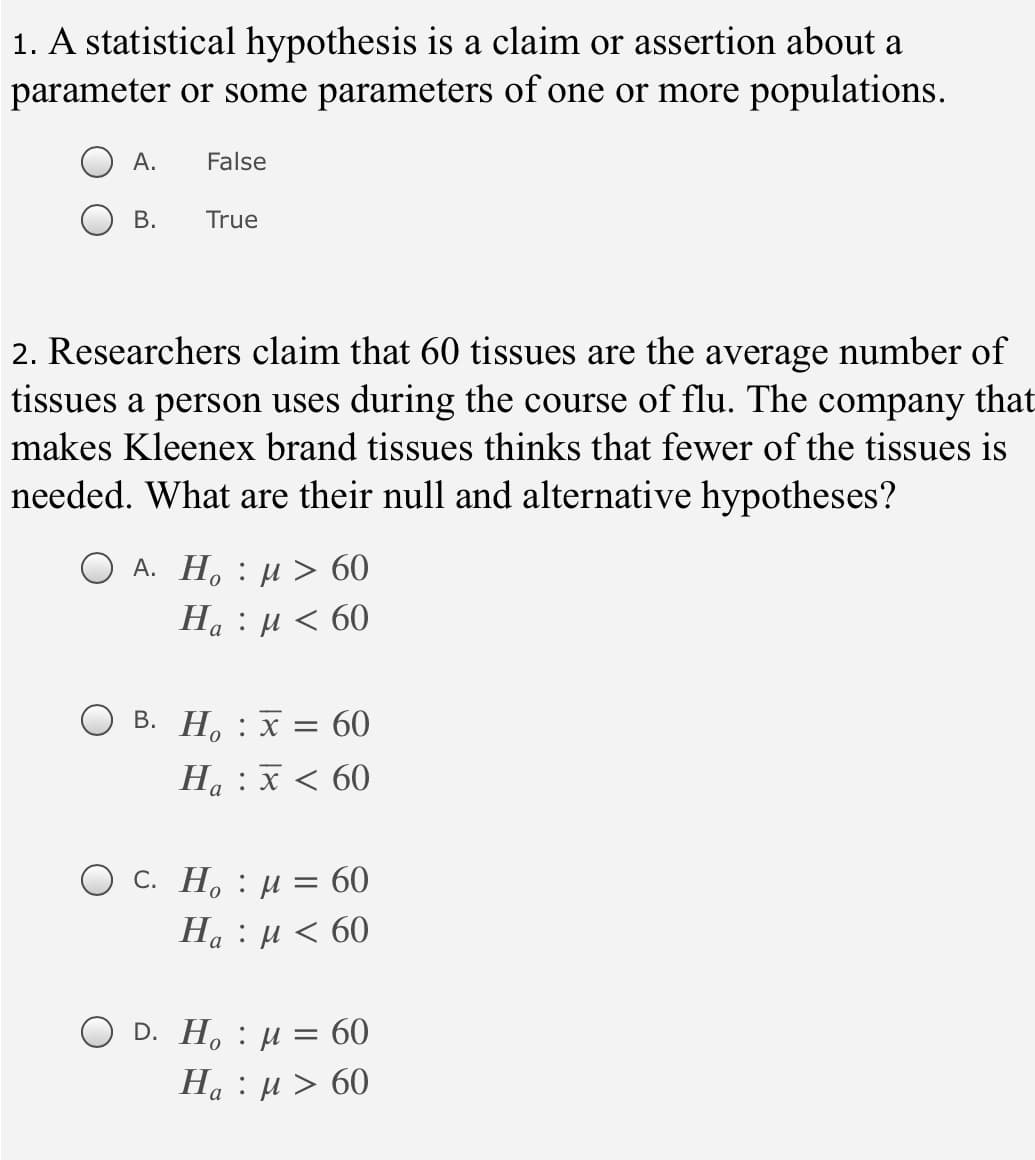
1. A statistical hypothesis is a claim or assertion about a parameter or some parameters of one or more populations. А. False В. True


Q: If the researcher decides to test this hypothesis at the a=0.05 level of significance, determine the...
A: It is given that Sample size n = 21 Sample SD s = 2.5 Test statistic = 103.306 Level of significance...
Q: Illustration 54. From the following data relating to the average quarterly prices of a commodity obt...
A:
Q: NOTE: THESE TOPICS ARE UNDER MATH SUBJECT FIRST STANZA: INTRODUCTION OF THE POEM SECOND STANZA: DES...
A: FIRST STANZA: Best measure of central tendency and dispersion. SECOND STANZA: Mean is a measure of ...
Q: Determine the minimum sample size required when you want to be 90% confident that the sample mean is...
A: Population standard deviation (σ) = 11.8 and confidence interval (c.i) = 90% and margin of error (E)...
Q: Discussion Topics: 1. Copy and paste the inverse cumulative distribution function figure. 2. What is...
A: The area to the right of z is 0.68. The area to the left of z is 1-0.68=0.32.
Q: Binomial formulai
A: Here we use the binomial distribution.
Q: In marketing children’s products, it is extremely important to produce television commercials that h...
A: Excel Procedure: Enter the data for Toys, Food, Children's clothing in Excel sheet. Go to Data Clic...
Q: From the data given below find the cost of living index number for 1998. Per cent of total Items Pri...
A:
Q: b) The table below shows the color and the model of cars purchased by 160 randomly selected customer...
A: For the given data Perform Chi square test
Q: multinational bank issuing Master Card is monitoring the use of credit card account holders in the c...
A: Here, mean is 2800 and standard deviation is 900. We want use z-standard normal distribution.
Q: For #2 - #6: A random sample of individuals (n=10) is selected from a population with u = 4. A treat...
A: We have given that, The data set are :- 4, 5, 7, 6, 9, 1, 2, 2, 4, 3 Then, We will find sample var...
Q: confidence level. What is the most conservative estimate of the sample size that will limit the maxi...
A: It is given that Margin of error E = 0.95 Level of confidence = 0.95 The critical value of Z at 95% ...
Q: e are the BMI statistics for random samples of men and women. Assume that the two samples are indepe...
A: Given data We want to test the hypothesis by using difference of of two means and 99% CI for popula...
Q: Assume that adults have IQ scores that are normally distributed with a mean of 103.4 and a standard ...
A:
Q: Exercise 2: Complete the table below and answer the following questions: Observation Sample Mean i 1...
A: For the given data Compute mean of the sampling distribution of means = ? Variance of the sampling...
Q: A market researcher analyzes how many electronics devices customers buy in a single purchase. The di...
A:
Q: The overhead reach distances of adult females are normally distributed with a mean of 205.5 cm and a...
A:
Q: Instruction: Determine whether the following statements has a known or unknown population variance a...
A: Hey there! Thank you for posting the question. Since your question has more than 3 parts, we are sol...
Q: Suppose (y/) ~ Poisson(0). Find Jeffrey's prior density for 0.
A:
Q: Consider the following propositions: PROPOSITION ONE: It is possible to implement a study to prove t...
A: PROPOSITION PROPOSITION ONE is false, while PROPOSITION TWO is correct.
Q: degree. Determine the most conservative estimate of the sample size required to limit the margin of ...
A: We have given that, Margin of error (E)= 0.06 and Confidence interval (C.I) = 90% = 0.90 then signi...
Q: 12. Find the variance of normal distribution.
A:
Q: Come from populations with the same mean. Assume that the samples are independent simple random samp...
A:
Q: Business Weekly conducted a survey of graduates from 30 top MBA programs. On the basis of the survey...
A:
Q: You measure 23 dogs' weights, and find they have a mean weight of 68 ounces. Assume the population s...
A:
Q: In a study of red/green color blindness, 850 men and 2900 women are randomly selected and tested. Am...
A: From the provided information,
Q: In a study of red/green color blindness, 850 men and 2900 women are randomly selected and tested. Am...
A: For the given data perform z test for two proportion
Q: The sample mean is the point estimator of 18
A:
Q: Construct a 99% confidence interval to assess whether this represents evidence that parents' attitud...
A:
Q: nen a stone is dropped in a pond, ripples are formed d travel in concentric circles away from where ...
A: Y=mx+c Where c=constant m= regression coefficients of x
Q: We have one (1) bin with balls. The bin contains twelve balls, three red, four green, and five blue....
A: The formula for combination is nCr = n! / [r! (n – r)!] = [n (n – 1) … (n – r + 1)]/r!. Explanation:...
Q: If the coefficient of determination is a positive value, then the regression equation could have eit...
A: R-squared or coefficient of determination: It is a statistical measure that represents the proportio...
Q: Based on the regression output, if you wanted to test whether the number of wins is related to the t...
A: Test is that whether the number of wins is related to the team payroll. It is given that P-value for...
Q: B. In each of the situations, answer the following: a) State the Null and Alternative hypothesis in ...
A: Introduction: Two different situations are presented here.
Q: The director of student services at Oxnard College is interested in whether women are more likely to...
A: There are two independent samples which are women and men. We have to test whether women are more li...
Q: A. A researcher measures the amount of sugar in several cans of the same soda. The mean is 39.01 wit...
A: According to guidelines we solve only first question when given questions are different.
Q: what is random variable? 2.can you give me an example of discrete random variable? 3.can you give ...
A: here use definition of terms given
Q: Question 1b The St. Lucian Government is interested in predicting the number of weekly riders on ...
A: Given Information: Consider the given data: Number of weekly riders (y) Price per week The popul...
Q: Drill lifetime: A sample of 50 drills had a mean lifetime of 12.46 holes drilled when drilling a low...
A: For the given data Find 95 % C.I
Q: The degrees-of-freedom for a chi-square test for c cross-tab is: O 18 O 12 10
A: In Chi-square test 3 by 6 cross-tab is given
Q: For the following population, calculate the mean, median, mode, variance, standard deviation, coeffi...
A: Use EXCEL Procedure for finding the given values. Follow the instruction to obtain the values: ...
Q: Suppose Z follows the standard normal distribution. Calculate the following probabilities using the ...
A: We have to find given probability....
Q: In dogs, being clumsy (C) is dominant to being cool (c), and being dazzling (D) is dominant to heing...
A: Given In dogs, being clumsy (C) is dominant to being cool (c), and being dazzling (D) is dominant t...
Q: 1. Xavier has a batting average of 0.320, which means that he hits the ball 32% of the time he is at...
A: We have given that the probability to hit the ball is p = 32% = 0.32. The sample size n = 7 and the ...
Q: Based on the regression output, what is the correlation between the two variables
A: It is given that SS(regression) = 1032.6 SS(residual) = 2109.7, then SS(total) = 1032.6+2109.7 = 314...
Q: Test for Potassium (Normal Value: 3.5-5.5 mmol/L) Day Result 1 3.5 3.6 3 4.5 4 3.6 5 4.9 4.5 7 3.8 M...
A: For the given data, we need to find: Day Result 1 3.5 2 3.6 3 4.5 4 3.6 5 4.9 6 4.5 ...
Q: What is the probability of drawing 2 red balls and then 3 blue balls from an urn containing 6 red ba...
A:
Q: Premature-birth Risk Found Higher for Teens (reported in the Sacramento Bee, April 27, 1995, p. A7) ...
A: Given Relative risk=1.9 Find Absolute risk for women in their 20's which is used as baseline
Q: 2. The life expectancy in the United States is 75 with a standard deviation of 7 years. A random sam...
A: Given data n=49 μ=75σ=7
Q: Based on the regression output, if you were to test the hypothesis that the coefficient on the Payro...
A: Test is that whether the coefficient on the Payroll variable was equal to 0 or not.


Trending now
This is a popular solution!

Step by step
Solved in 2 steps

- Daily anxiety was measured on a scale from 1 (not at all anxious) to 5 (very anxious) in a random sample of 2000 city dwellers from across the U.S. They found that M = 4.13, 95% CIs [4.06, 4.20].How would you interpret these results? What conclusions would you draw about the precision of the point estimate? What statistical decision would have been made in this scenario if the researchers employed Null Hypothesis Significance Testing instead of the New Stats?1. The sample mean weights for two varieties of lettuce grown for 16 days in a controlled environment are 3.259 and 1.413 and the corresponding sample standard deviations are .400 and .220. If the sample sizes for the two varieties are 9 and 6 respectively, what would be the pair of hypotheses to test if the two varieties of lettuce have the same average weight? (Given: weight of each variety of lettuce is normally distributed). A. H0: μ1 ≠ μ2 vs H1: μ1 = μ2 B. H0: μ1 = μ2 vs H1: μ1 ≠ μ2 C. H0: μ1 > μ2 vs H1: μ1 ≤ μ2 D. H0: μ1 ≤ μ2 vs H1: μ1 > μ2 2. At 5% level, what are the critical values for testing equality of mean weights in problem 1? A. 2.18 B. -2.18 and 2.18 C. -1.78 D.-1.78 and 1.78 3.What is the best decision using critical value approach in problem 1? A. The computed test statistic falls in the critical region and we do not reject the null hypothesis. B. The computed test statistic does not fall in the critical…1. The sample mean weights for two varieties of lettuce grown for 16 days in a controlled environment are 3.259 and 1.413 and the corresponding sample standard deviations are .400 and .220. If the sample sizes for the two varieties are 9 and 6 respectively, what would be the pair of hypotheses to test if the two varieties of lettuce have the same average weight? (Given: weight of each variety of lettuce is normally distributed). A. H0: μ1 ≠ μ2 vs H1: μ1 = μ2 B. H0: μ1 = μ2 vs H1: μ1 ≠ μ2 C. H0: μ1 > μ2 vs H1: μ1 ≤ μ2 D. H0: μ1 ≤ μ2 vs H1: μ1 > μ2 2.What would be the degree of freedom for the test statistic in problem 1? A. 6 B. 9 C. 12.7 D. 14 3. What would be the computed test statistic in problem 1? A. 2.93 B. 3.57 C. 8.44 D. 11.48
- 1. The sample mean weights for two varieties of lettuce grown for 16 days in a controlled environment are 3.259 and 1.413 and the corresponding sample standard deviations are .400 and .220. If the sample sizes for the two varieties are 9 and 6 respectively, what would be the pair of hypotheses to test if the two varieties of lettuce have the same average weight? (Given: weight of each variety of lettuce is normally distributed). A. H0: μ1 ≠ μ2 vs H1: μ1 = μ2 B. H0: μ1 = μ2 vs H1: μ1 ≠ μ2 C. H0: μ1 > μ2 vs H1: μ1 ≤ μ2 D. H0: μ1 ≤ μ2 vs H1: μ1 > μ2 2. What is the best decision using critical value approach in problem 1? A. The computed test statistic falls in the critical region and we do not reject the null hypothesis. B. The computed test statistic does not fall in the critical region and we do not reject the null hypothesis. C. The computed test statistic falls in the critical region and we reject the null hypothesis. D.The computed…1. The sample mean weights for two varieties of lettuce grown for 16 days in a controlled environment are 3.259 and 1.413 and the corresponding sample standard deviations are .400 and .220. If the sample sizes for the two varieties are 9 and 6 respectively, what would be the pair of hypotheses to test if the two varieties of lettuce have the same average weight? (Given: weight of each variety of lettuce is normally distributed). A. H0: μ1 ≠ μ2 vs H1: μ1 = μ2 B. H0: μ1 = μ2 vs H1: μ1 ≠ μ2 C.H0: μ1 > μ2 vs H1: μ1 ≤ μ2 D. H0: μ1 ≤ μ2 vs H1: μ1 > μ2 2. What is the best decision using critical value approach in problem 1? A. The computed test statistic falls in the critical region and we do not reject the null hypothesis. B. The computed test statistic does not fall in the critical region and we do not reject the null hypothesis. C. The computed test statistic falls in the critical region and we reject the null hypothesis. D. The computed test statistic does not fall…Suppose the average blood sugar level in 35- to 44-year-olds is 4.86 (mmol/L). Do sedentary people have a different blood sugar level than that of the general population? To answer that question, a hypothesis test is planned to collect data from a group of 200 sedentary people in this age group. State the null and alternative hypothesis for this study. A. H0: u (mean) ≠ 4.86 mmol/L vs Ha: u (mean) = 4.86 mmol/L B. H0: u (mean) = 4.86 mmol/L vs Ha: xbar ≠ 4.86 mmol/L C. H0: u (mean) = 4.86 mmol/L vs Ha: u (mean) > 4.86 mmol/L D. H0: u(mean) = 4.86 mmol/L vs Ha: u (mean) ≠ 4.86 mmol/L
- Suppose we take a sample of 2,500 blood donors from a population for which 50% (0.5) have type O+ blood. (a) Into what range of possible values should the sample proportion fall 95% of the time, according to the Empirical Rule? to (b) If the sample included only 625 donors instead of 2,500, would the range of possible sample proportions be wider, more narrow, or the same as with a sample of 2,500 donors? Explain your answer, and explain why it makes intuitive sense. The range would be with 625 donors compared to a sample of 2,500 donors since the standard deviation of the sampling distribution would be . This makes intuitive sense because if fewer donors are included in the sample, the proportion will be reliable as an estimate of the proportion.3) A firm in Lebanon has developed a chemical solution that can be added to car gasolinewhich they believe will increase the miles per gallon that cars will get. The owners areinterested in estimating the difference between mean mpg for cars using the chemicalsolution versus those that are not using the solution. The following data represent the mpgfor independent random samples of cars from each population.with Solution without Solution______________________________n1 = 36 n2 = 42 x1 = 25.45 x2 = 24.1 _______________________________Assume that the populations are normally distributed and the population standarddeviations are known to be σ1 = 3.95 (with solution) and σ2 = 3.09 (without solution).Given this data, can the owners believe that there is a difference between mean mpg forcars using the chemical solution versus those that are not using the solution? Test using analpha level equal to 0.05.4) Given the following null and alternative hypothesis:H0: σ 2 ≤ 52HA : σ 2 > 52and the…Suppose θb is an unbiased point estimator for a parameter θ. We obtain 10,000 different random samples and we compute the value of θb every time. Can we say that θb will underestimate θ a total of 5000 times and it will overestimate θ another 5000 times? What do you expect to see in this experiment?
- From a study from earlier this year, it is believed that approximately 7% of U.S. adults do not use the internet. Suppose researchers are doing a study to see if the proportion of Washington state adults that do not use the internet is lower than the reported U.S. adult proportion. The researchers decide to survey 200 randomly selected adults throughout the state of Washington. a. Define a parameter for hypothesis testing and write the null hypothesis and alternative hypothesis for this studyThe worker on examining his 20 rainfall sample points concluded that it is more than likely to rain on this May 1st. Describe two or three statistical steps he took to arrive at this conclusion.A certain financial services company uses surveys of adults age 18 and older to determine if personal financial fitness is changing over time. A recent sample of 1,000 adults showed 410 indicating that their financial security was more than fair. Suppose that just a year before, a sample of 1,200 adults showed 420 indicating that their financial security was more than fair. (a) State the hypotheses that can be used to test for a significant difference between the population proportions for the two years. (Let p1 = population proportion most recently saying financial security more than fair and p2 = population proportion from the year before saying financial security more than fair. Enter != for ≠ as needed.) H0: p1−p2=0 Ha: p1−p2!=0 (b) Conduct the hypothesis test and compute the p-value. At a 0.05 level of significance, what is your conclusion? Find the value of the test statistic. (Use p1 − p2. Round your answer to two decimal places.) Find the p-value.…


