1. Look at the colors in your genetic drift population and the corresponding percentages. Now, compare those to the same colors/percentages in the original population (for example, in the genetic drift population, red might have had percentage of 50% while in the original population red was only 16%). Write these comparisons down in a list format. 2. Does the new genetic drift population accurately represent the original population? Explain by citing your data. 3. What colors in the original population are NOT represented in the genetic drift population?
1. Look at the colors in your genetic drift population and the corresponding percentages. Now, compare those to the same colors/percentages in the original population (for example, in the genetic drift population, red might have had percentage of 50% while in the original population red was only 16%). Write these comparisons down in a list format. 2. Does the new genetic drift population accurately represent the original population? Explain by citing your data. 3. What colors in the original population are NOT represented in the genetic drift population?

Concepts of Biology
1st Edition
ISBN:9781938168116
Author:Samantha Fowler, Rebecca Roush, James Wise
Publisher:Samantha Fowler, Rebecca Roush, James Wise
Chapter11: Evolution And Its Processes
Section: Chapter Questions
Problem 7RQ: In which of the following pairs do both evolutionary processes introduce new genetic variation into...

Related questions
Question
100%
Transcribed Image Text:Answer the following questions:
1. Look at the colors in your genetic drift population and the corresponding
percentages. Now, compare those to the same colors/percentages in the original
population (for example, in the genetic drift population, red might have had
percentage of 50% while in the original population red was only 16%). Write these
comparisons down in a list format.
2. Does the new genetic drift population accurately represent the original population?
Explain by citing your data.
3. What colors in the original population are NOT represented in the genetic drift
population?
4. When you compare the percentages of each color, are they the same for the original
population and the genetic drift population? Explain.
5. Let's assume that the candies are all the same type of organism (like, praying
mantises) and that the new environment consists of lots of greenery and many bright
red flowers. Which colors in the genetic drift population would have better fitness in
this new environment? Why/how? How might that affect the alleles for those
individuals?
6. Which ones would have less fitness? Why/how? What might happen to the alleles
for those individuals that have less fitness?
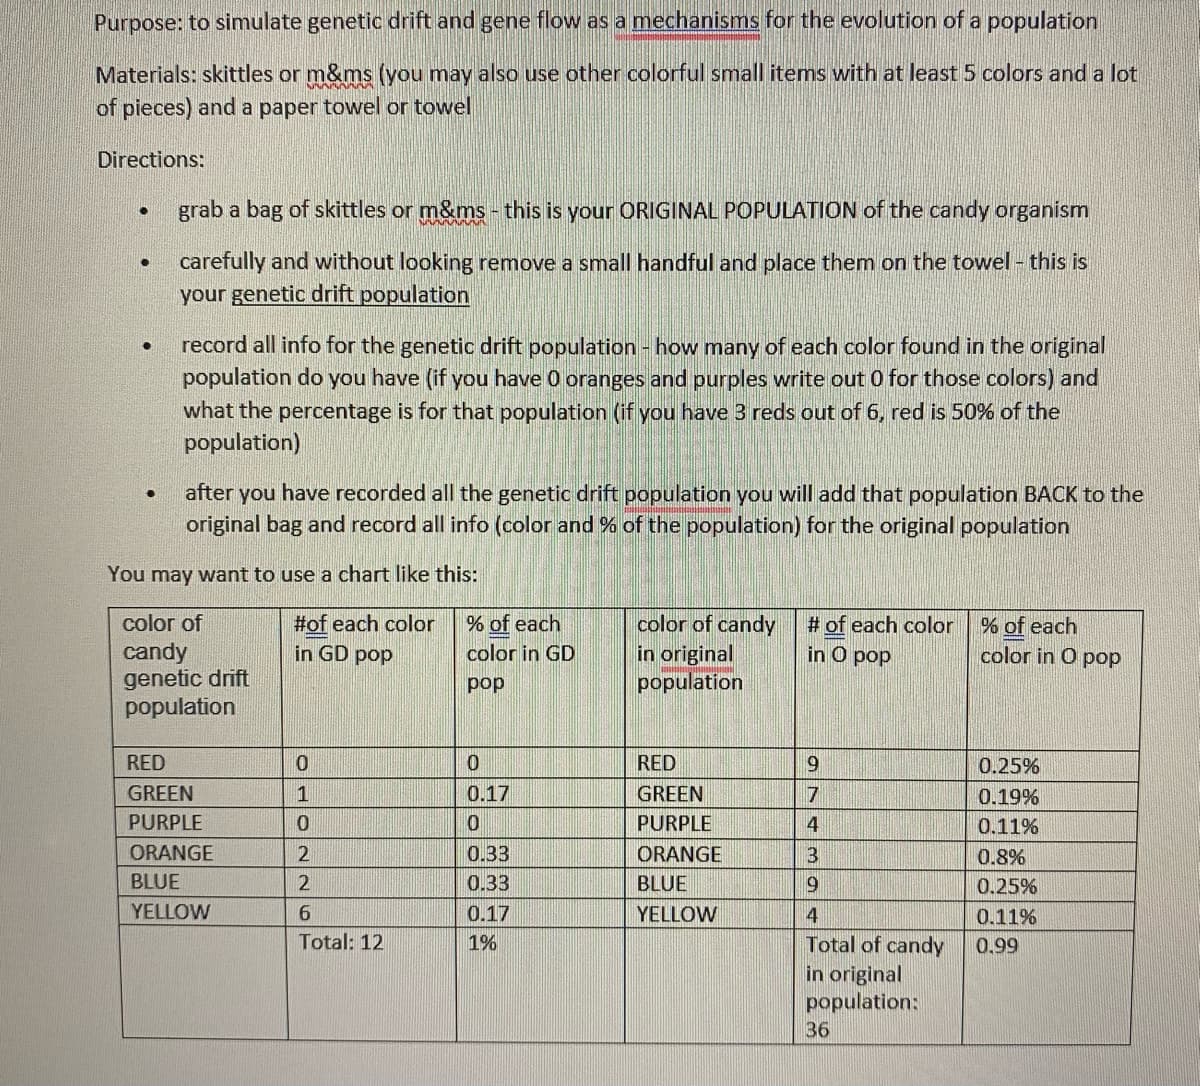
Transcribed Image Text:Purpose: to simulate genetic drift and gene flow as a mechanisms for the evolution of a population
Materials: skittles or m&ms (you may also use other colorful small items with at least 5 colors and a lot
of pieces) and a paper towel or towel
Directions:
●
●
●
grab a bag of skittles or m&ms - this is your ORIGINAL POPULATION of the candy organism
carefully and without looking remove a small handful and place them on the towel - this is
your genetic drift population
●
record all info for the genetic drift population - how many of each color found in the original
population do you have (if you have 0 oranges and purples write out 0 for those colors) and
what the percentage is for that population (if you have 3 reds out of 6, red is 50% of the
population)
after you have recorded all the genetic drift population you will add that population BACK to the
original bag and record all info (color and % of the population) for the original population
You may want to use a chart like this:
color of
candy
genetic drift
population
RED
GREEN
PURPLE
ORANGE
BLUE
YELLOW
#of each color
in GD pop
0
1
0
2
2
6
Total: 12
% of each
color in GD
pop
0
0.17
0
0.33
0.33
0.17
1%
color of candy
in original
population
RED
GREEN
PURPLE
ORANGE
BLUE
YELLOW
# of each color
in O pop
9
7
4
3
9
4
Total of candy
in original
population:
36
% of each
color in O pop
0.25%
0.19%
0.11%
0.8%
0.25%
0.11%
0.99
Expert Solution
This question has been solved!
Explore an expertly crafted, step-by-step solution for a thorough understanding of key concepts.

This is a popular solution!

Trending now
This is a popular solution!

Step by step
Solved in 3 steps

Knowledge Booster


Learn more about
Need a deep-dive on the concept behind this application? Look no further. Learn more about this topic, biology and related others by exploring similar questions and additional content below.Recommended textbooks for you
Concepts of Biology
Biology
ISBN:
9781938168116
Author:
Samantha Fowler, Rebecca Roush, James Wise
Publisher:
OpenStax College

Biology Today and Tomorrow without Physiology (Mi…
Biology
ISBN:
9781305117396
Author:
Cecie Starr, Christine Evers, Lisa Starr
Publisher:
Cengage Learning
Concepts of Biology
Biology
ISBN:
9781938168116
Author:
Samantha Fowler, Rebecca Roush, James Wise
Publisher:
OpenStax College
Biology Today and Tomorrow without Physiology (Mi…
Biology
ISBN:
9781305117396
Author:
Cecie Starr, Christine Evers, Lisa Starr
Publisher:
Cengage Learning