1. Looking at the output, what is the mean temperature in Des Moines on April 14? What is the mean temperature in San Francisco on April 14? 2. What is the mean difference in temperatures between Des Moines and San Francisco? 3. In the Paired Samples box of the output, the value t is the test statistic, and the value Sig. (2-tailed)is the 2-tailed p-value.(Note that we are looking for the two-tailed p-value,so we do NOT need to divide by 2.)What is the test statistic? What is our p-value?


Inverse Normal Distribution
The method used for finding the corresponding z-critical value in a normal distribution using the known probability is said to be an inverse normal distribution. The inverse normal distribution is a continuous probability distribution with a family of two parameters.
Mean, Median, Mode
It is a descriptive summary of a data set. It can be defined by using some of the measures. The central tendencies do not provide information regarding individual data from the dataset. However, they give a summary of the data set. The central tendency or measure of central tendency is a central or typical value for a probability distribution.
Z-Scores
A z-score is a unit of measurement used in statistics to describe the position of a raw score in terms of its distance from the mean, measured with reference to standard deviation from the mean. Z-scores are useful in statistics because they allow comparison between two scores that belong to different normal distributions.
You are thinking of moving to either Des Moines, Iowa or San Francisco, California. Afriend claims that Des Moines’s winters last forever, and so it is always cold in Des Moines. You decide to look at the temperature in each city on April 14 from 1995 to 2010 to see if the weather is really that much different in Des Moines in April than in San Francisco.
1. Looking at the output, what is the
2. What is the mean difference in temperatures between Des Moines and San Francisco?
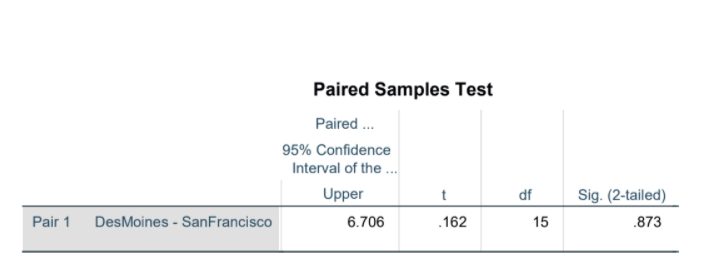
3. In the Paired Samples box of the output, the value t is the test statistic, and the value Sig. (2-tailed)is the 2-tailed p-value.(Note that we are looking for the two-tailed p-value,so we do NOT need to divide by 2.)What is the test statistic? What is our p-value?
![T-Test
[DataSetl] W:\syr\CourseInformation\MTH 112\dilmore\April14Temps.sav
Paired Samples Statistics
Mean
N
Std. Deviation Std. Error Mean
Pair 1
DesMoines
54.49
16
11.730
2.933
SanFrancisco
54.01
16
3.377
.844
Paired Samples Correlations
N
Correlation
Sig.
Pair 1 DesMoines & SanFrancisco
16
.155
.566
Paired Samples Test
Paired Differences
95%
Confidence.
Mean
Std. Deviation Std. Error Mean
Lower
Pair 1 DesMoines - SanFrancisco
.475
11.693
2.923
-5.756](/v2/_next/image?url=https%3A%2F%2Fcontent.bartleby.com%2Fqna-images%2Fquestion%2F7fdf336d-4f09-474f-8885-c9f1cef645bf%2Ff9894502-1df8-45c7-9af6-5616bd6372e0%2Fvtl9dmk_processed.png&w=3840&q=75)

Step by step
Solved in 2 steps


