1. Oil leaked from a tank at a rate of r(t) liters per hour. The rate decreased as time passed, and values of the rate at two hour time intervals are shown in the table. Find lower and upper estimates for the total amount of oil that leaked out. Va L (lower estimate) ]L (upper estimate) Va E (h) r(e) (L/h) 8.6 7.9 6.8 6.4 5.7 5.3 02 46 8 10 The velocity graph of a car accelerating from rest to a speed of 75 km/h over a perlod of 30 seconds is shown. Estimate the distance traveled during this perlod. (Use M, to get the most precise estimate. Round your answer to two decimal places.) km v (km/h) 75 50 25 t (seconds) 10 20 30
1. Oil leaked from a tank at a rate of r(t) liters per hour. The rate decreased as time passed, and values of the rate at two hour time intervals are shown in the table. Find lower and upper estimates for the total amount of oil that leaked out. Va L (lower estimate) ]L (upper estimate) Va E (h) r(e) (L/h) 8.6 7.9 6.8 6.4 5.7 5.3 02 46 8 10 The velocity graph of a car accelerating from rest to a speed of 75 km/h over a perlod of 30 seconds is shown. Estimate the distance traveled during this perlod. (Use M, to get the most precise estimate. Round your answer to two decimal places.) km v (km/h) 75 50 25 t (seconds) 10 20 30

University Physics Volume 1
18th Edition
ISBN:9781938168277
Author:William Moebs, Samuel J. Ling, Jeff Sanny
Publisher:William Moebs, Samuel J. Ling, Jeff Sanny
Chapter1: Units And Measurement
Section: Chapter Questions
Problem 1.3CYU: Check Your Understanding We know horn Figure 1.4 that the diameter of Earth is on the order of 107m...

Related questions

Question
#2
Transcribed Image Text:Page
1
>
of 6
ZOOM
+
-
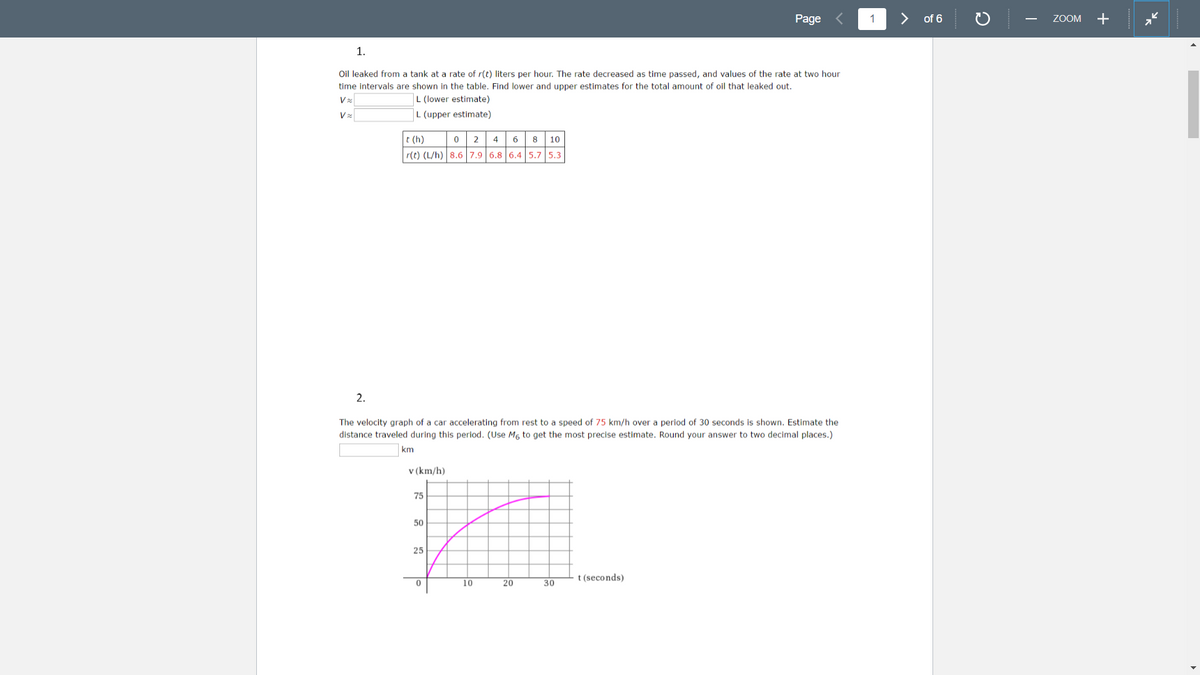
1.
Oil leaked from a tank at a rate of r(t) liters per hour. The rate decreased as time passed, and values of the rate at two hour
time intervals are shown in the table. Find lower and upper estimates for the total amount of oil that leaked out.
L (lower estimate)
L (upper estimate)
t (h)
0 2 4
6
8
10
r(t) (L/h) 8.6 7.9 6.8 6.4 5.7 5.3
2.
The velocity graph of a car accelerating from rest to a speed of 75 km/h over a period of 30 seconds is shown. Estimate the
distance traveled during this period. (Use Mg to get the most precise estimate. Round your answer to two decimal places.)
km
v (km/h)
75
50
25
t (seconds)
10
20
30
Expert Solution
This question has been solved!
Explore an expertly crafted, step-by-step solution for a thorough understanding of key concepts.

Step by step
Solved in 2 steps

Knowledge Booster


Learn more about
Need a deep-dive on the concept behind this application? Look no further. Learn more about this topic, physics and related others by exploring similar questions and additional content below.Recommended textbooks for you
University Physics Volume 1
Physics
ISBN:
9781938168277
Author:
William Moebs, Samuel J. Ling, Jeff Sanny
Publisher:
OpenStax - Rice University
University Physics Volume 1
Physics
ISBN:
9781938168277
Author:
William Moebs, Samuel J. Ling, Jeff Sanny
Publisher:
OpenStax - Rice University