1. Plot the message signal and its integral on two separate graphs. The sampling interval is t, = 0.0001.
1. Plot the message signal and its integral on two separate graphs. The sampling interval is t, = 0.0001.

Algebra & Trigonometry with Analytic Geometry
13th Edition
ISBN:9781133382119
Author:Swokowski
Publisher:Swokowski
Chapter5: Inverse, Exponential, And Logarithmic Functions
Section5.6: Exponential And Logarithmic Equations
Problem 64E

Related questions

Topic Video
Question
Please write matlab code with comments.
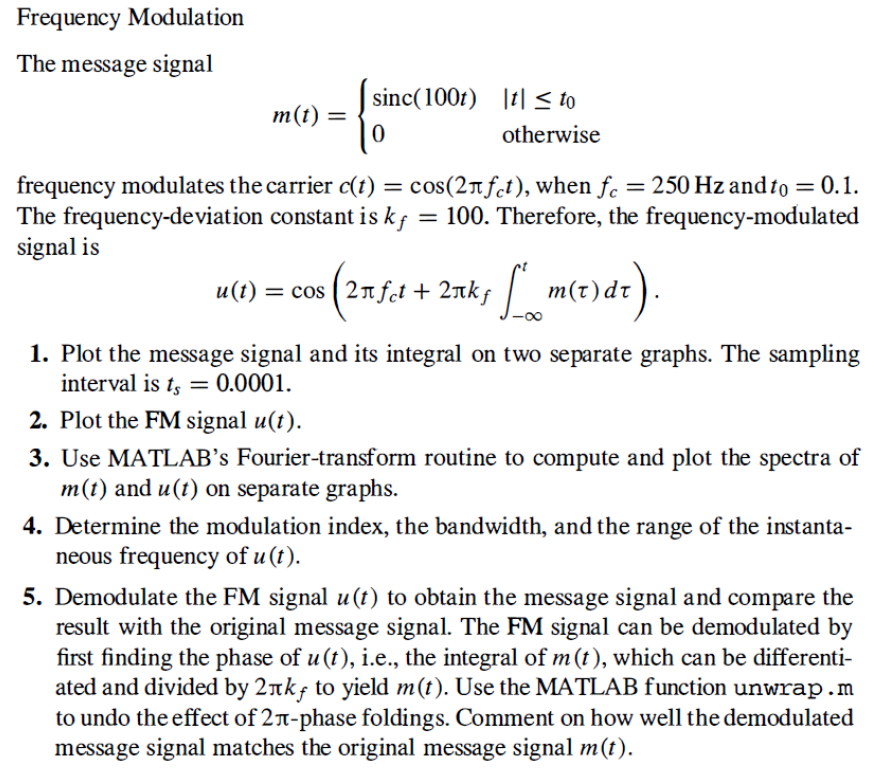
Transcribed Image Text:Frequency Modulation
The message signal
sinc(100f) |t| < to
m(t) =
otherwise
frequency modulates the carrier c(t) = cos(2nfet), when f. = 250 Hz and to = 0.1.
The frequency-deviation constant is kf = 100. Therefore, the frequency-modulated
signal is
u(t) = cos (2nft + 2nks m(t)dt).
1. Plot the message signal and its integral on two separate graphs. The sampling
interval is t, = 0.0001.
2. Plot the FM signal u(t).
3. Use MATLAB’s Fourier-transform routine to compute and plot the spectra of
m(t) and u(t) on separate graphs.
4. Determine the modulation index, the bandwidth, and the range of the instanta-
neous frequency of u (t).
5. Demodulate the FM signal u(t) to obtain the message signal and compare the
result with the original message signal. The FM signal can be demodulated by
first finding the phase of u (t), i.e., the integral of m(t), which can be differenti-
ated and divided by 2nkf to yield m(t). Use the MATLAB function unwrap.m
to undo the effect of 2T-phase foldings. Comment on how well the demodulated
message signal matches the original message signal m(t).
Expert Solution
This question has been solved!
Explore an expertly crafted, step-by-step solution for a thorough understanding of key concepts.

This is a popular solution!

Trending now
This is a popular solution!

Step by step
Solved in 3 steps with 1 images

Knowledge Booster


Learn more about
Need a deep-dive on the concept behind this application? Look no further. Learn more about this topic, advanced-math and related others by exploring similar questions and additional content below.Recommended textbooks for you
Algebra & Trigonometry with Analytic Geometry
Algebra
ISBN:
9781133382119
Author:
Swokowski
Publisher:
Cengage

College Algebra
Algebra
ISBN:
9781305115545
Author:
James Stewart, Lothar Redlin, Saleem Watson
Publisher:
Cengage Learning

Linear Algebra: A Modern Introduction
Algebra
ISBN:
9781285463247
Author:
David Poole
Publisher:
Cengage Learning
Algebra & Trigonometry with Analytic Geometry
Algebra
ISBN:
9781133382119
Author:
Swokowski
Publisher:
Cengage
College Algebra
Algebra
ISBN:
9781305115545
Author:
James Stewart, Lothar Redlin, Saleem Watson
Publisher:
Cengage Learning
Linear Algebra: A Modern Introduction
Algebra
ISBN:
9781285463247
Author:
David Poole
Publisher:
Cengage Learning

Functions and Change: A Modeling Approach to Coll…
Algebra
ISBN:
9781337111348
Author:
Bruce Crauder, Benny Evans, Alan Noell
Publisher:
Cengage Learning

Trigonometry (MindTap Course List)
Trigonometry
ISBN:
9781337278461
Author:
Ron Larson
Publisher:
Cengage Learning