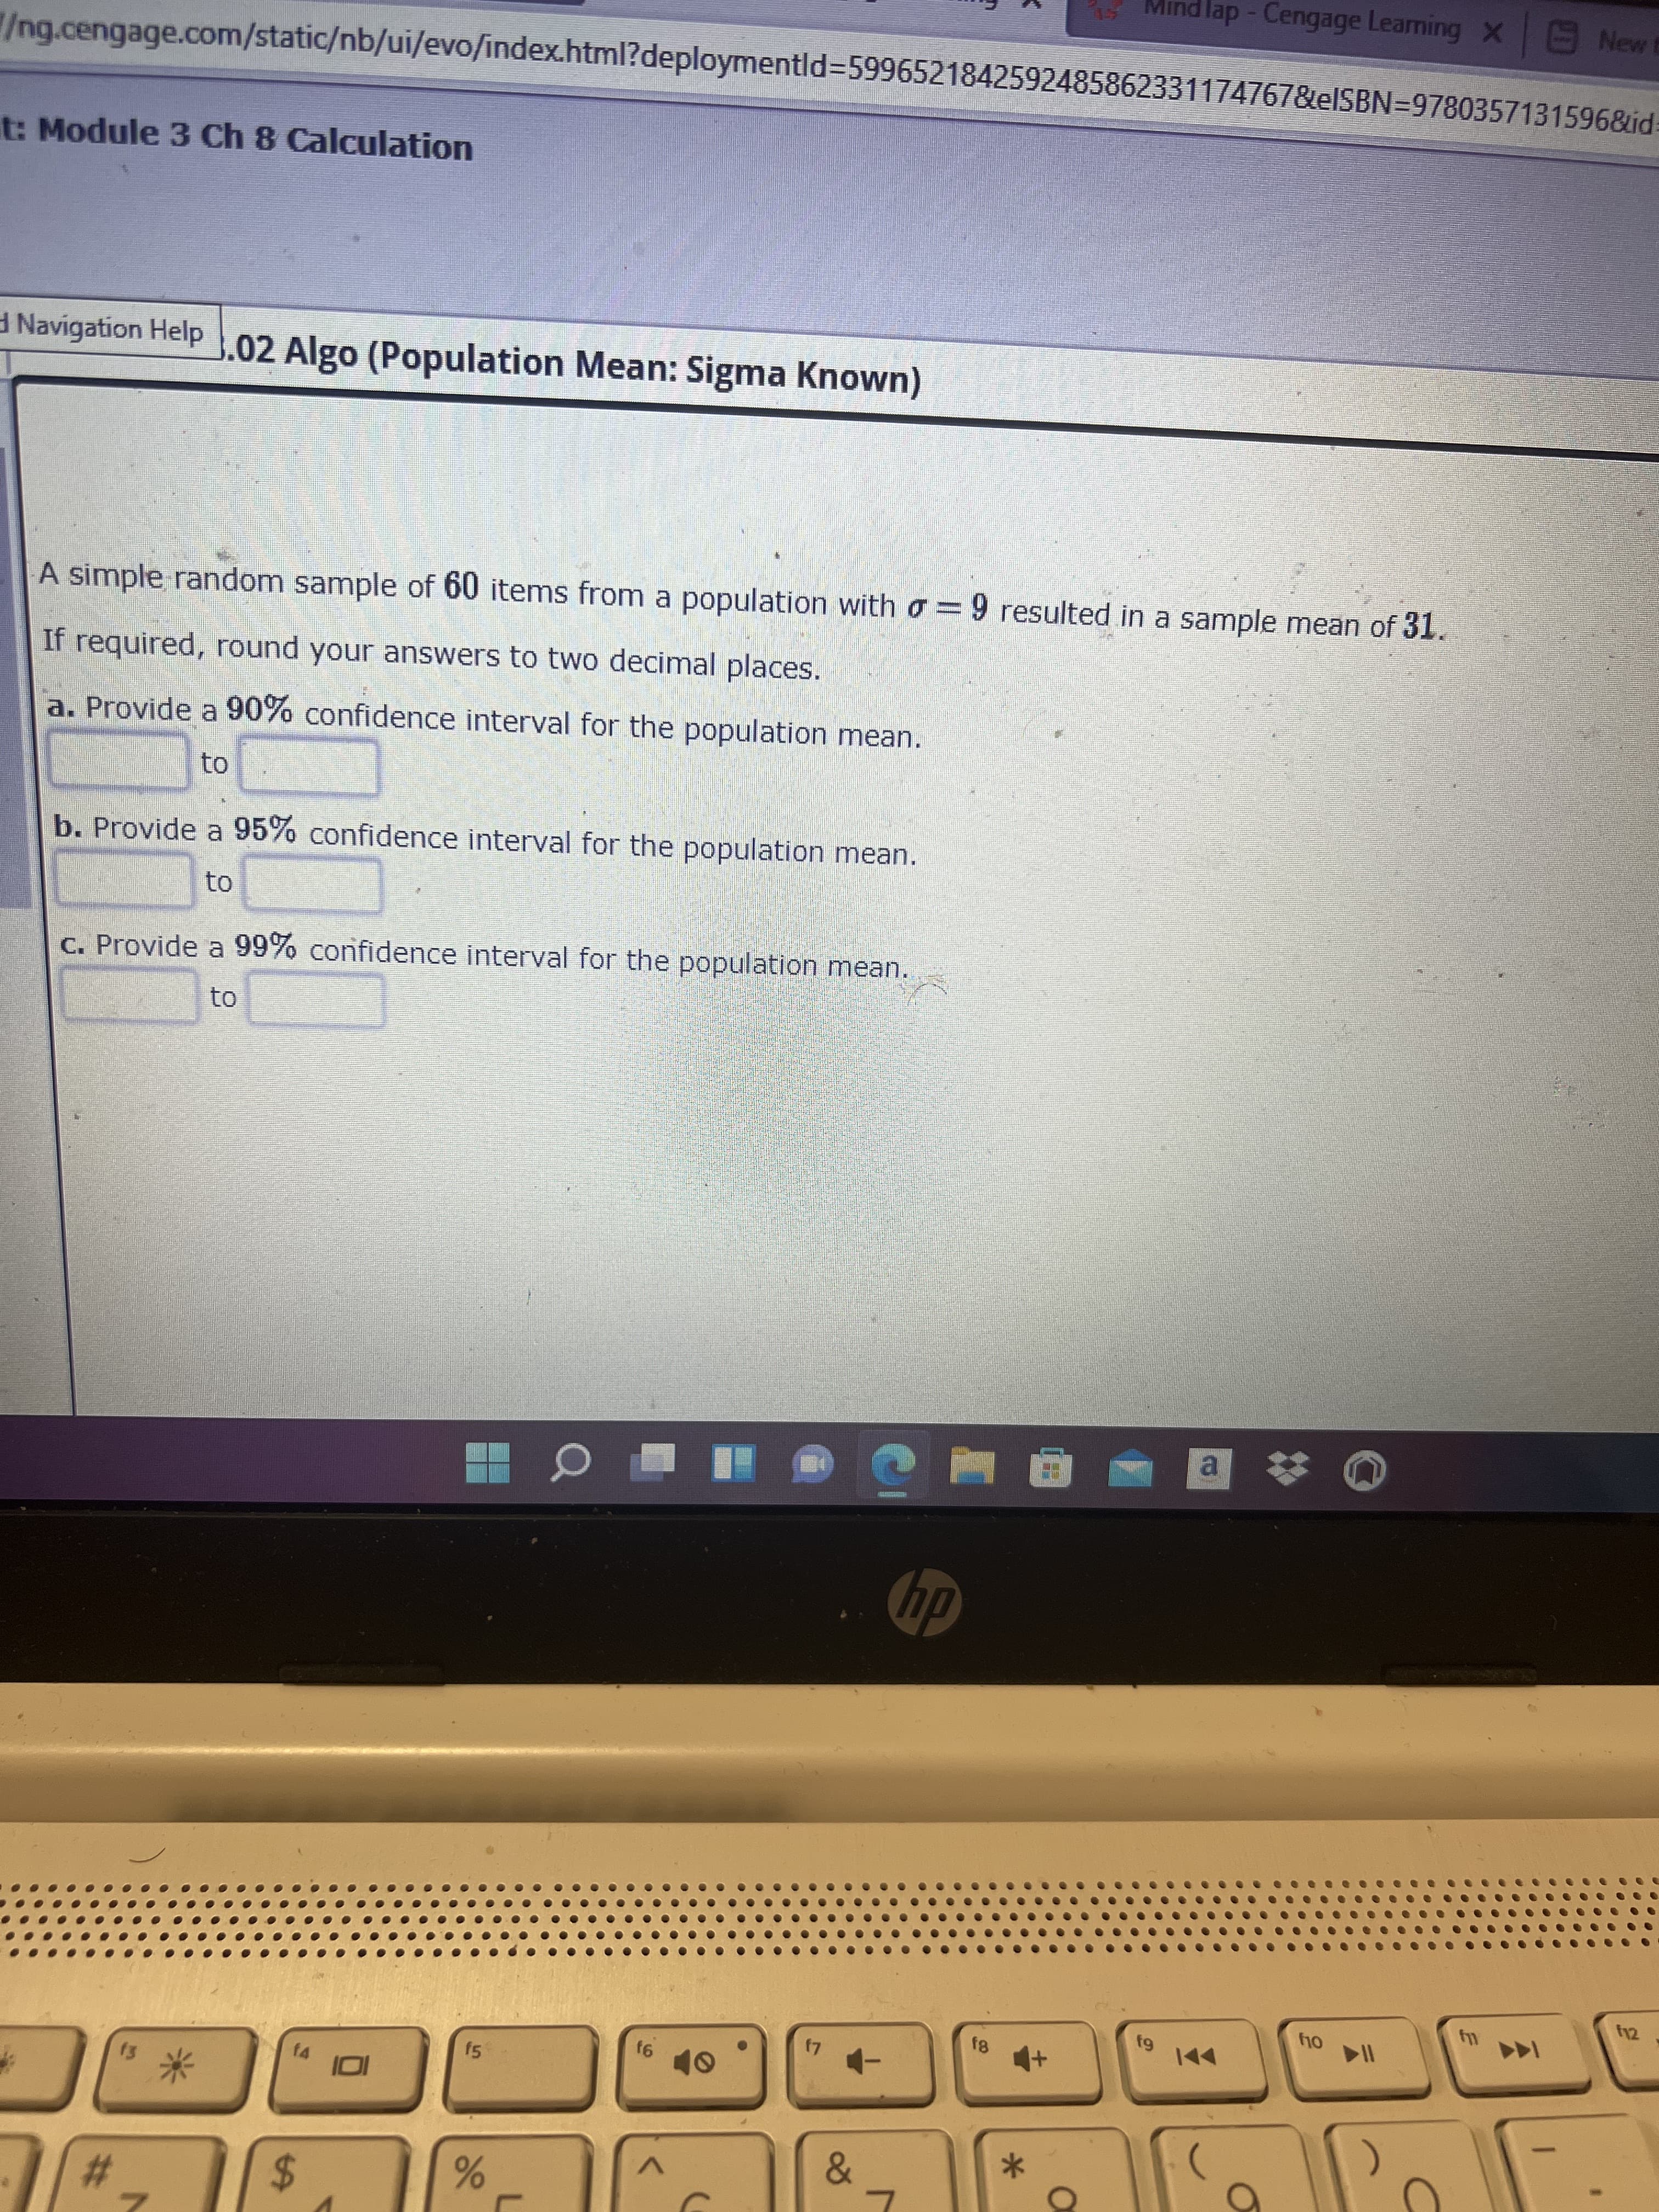
A simple random sample of 60 items from a population with o = 9 resulted in a sample mean of 31. If required


Q: Is it possible to interpret the y-intercept? Explain. (Choose one) ▼ the x-values are all (Choose on...
A: The objective is to find if is possible to intercept the y-intercept.
Q: The number of defects per. unit in a sample of 330 units of a manufactured product was found as foll...
A:
Q: According to a report by the U.S. Fish and Wildlife Service, the mean length of six-year-old rainbow...
A: As per Bartleby guideline expert have to answer first question only dear student please upload other...
Q: Lesson 10 Q8 The probability distribution of a random variable is given below. Find the value of a...
A: X 0 1 2 P(X) 2a a 3a
Q: 4.34 The probability density function of a random variable X is shown below. (a) Find the valne of A...
A:
Q: . Adult men Stride length (meters) 2.5 3.0 3.3 3.5 3.8 4.0 4.2 4.5 Speed (meters per second) 3.4 4.9...
A: We have given that, The data set is, Stride length (X) :- 2.5, 3.0, 3.3, 3.5, 3.8, 4.0, 4.2, 4.5 S...
Q: Compare the two models based on the forecast errors. Which is the appropriate model to use? Why? Sea...
A: Given the data as Time (t) Sales Seasonally adjusted linear trend (Ft/s) 1 184 222.25 2 22...
Q: 1800 candidates appeared for an examination, 450 were successful, 340 had attended a coaching class ...
A: Given that Number of candidates (N)=1800 450 were successful 340 attended Coaching classes Out of ...
Q: Salaries of 47 college graduates who took a statistics course in college have a mean, x, of $62,600....
A:
Q: %24 6. E Module 3 Ch 8 Calculation MindTap - Cengage Learning X MindTap - Cengage Learning X E Home-...
A: As per guidelines expert have to answer first question only dear student please upload other subpart...
Q: In this assignment, I would like you to compute the chi-square goodness of fit test for an observed ...
A: Given Information:Consider the data that shows the observed counts of F2 offspring from an F1 cross....
Q: 4. If {X(t)} is a WSS process and if Y(t) = | h(u)X(t – u)du, then Ry,(T) = R„(T)* K(t), K(t) = h(t)...
A:
Q: . A milk producers union wishes to test whether the preference pattern of consumers tor its products...
A:
Q: If 5 points were added to each score, then standard deviation of the new scores tyould a) be increas...
A: If 5 points were added to each score,then SD of the new scores would
Q: The following data gives the profits of a firm (in lakh dollars). Interpolate the missing figures. 1...
A:
Q: Joseph has taken two tests in his chemistry class. He scored 72 on the first test, for which the mea...
A: GivenFor first test:-x=72Mean(μ)=65standard deviation(σ)=8For second test:-x=60Mean(μ)=45standard de...
Q: NBC News/Marist sampled 603 likely voters on 10-31-14. They found that 44% said they would vote for ...
A: Givensample size(n)=603point estimate(p^)=0.44
Q: Two samples are drawn from two normal population. From the following data test whether the two sampl...
A: There are two independent samples which are sample 1 and sample 2. We have to test whether the two s...
Q: Two samples are drawn from two normal population. From the following data test whether the two sampl...
A: The F test are used to measure the significance between the variance between the two samples. It is ...
Q: In an experiment on pea-breeding Mendel obtained the following frequencies of seed : 315 round and y...
A:
Q: Suppose that a satellite defense system has 3 satellites that operate independently. Each satellite...
A: It is needed to determine the probability distribution for the random variable X.
Q: is given by (X – Y) ± Z V where Z. is a real number such that PİZ > 7.) 4 for Z ~ N(0, ).
A:
Q: 17. A clinical trial is run to assess the efficacy of a new pacemaker device in patients with atrial...
A: Solution: 17)
Q: Question 5 The radius of a confidence interval is called the O confidence level O margin of error O ...
A:
Q: Below are the jersey numbers of 11 players randomly selected from a football team. Find the range, v...
A:
Q: P/Example 8-14. Show that the rth moment µ,' about the origin of the binomial ... (*) distribution o...
A:
Q: Attempt the following: (i) P(A) = 0.75, P(B) = 0.50 and P(A U B) = 0.87, are the events A and B inde...
A:
Q: Let X1,..., Xn an iid random sample from Gamma(a, X). Show that [I-1 X; and E X; are jointly suffici...
A: Given: random variables Xi (i=1,2,....n) are iid from gamma(α,λ) then to show that ∏Xi and ∑Xi is ...
Q: Donot copy chegg answer that is wrong otherwise i dislike it ,,? During the first 14 weeks of a p...
A: The hypotheses are given below: Null hypothesis: H0: p=0.5. Alternative hypothesis: Ha:p>0.5. Sin...
Q: 2. Suppose the numbers given bellow are the percentage of elligible voters who actually voted during...
A: Trimmed mean : Like the mean and median, a truncated mean or trimmed mean is a statistical measure o...
Q: From the following data construct an index for 2016 taking 2017 as base : Commodity A B Price in 201...
A:
Q: Price of eggs and milk: The following table presents the average price in dollars for a dozen eggs a...
A:
Q: Look up the average evaluation score earned by instructor Egan for the Emergency Care course: In cel...
A: Given information: Evaluations: Average scores Instructor Barca Egan Gomez Tham Emergency Car...
Q: Central Limit Theorem for Sums Suppose random samples of n = 37 are collected from an unknown distri...
A:
Q: Directions: Create two (2) problems illustrating a permutation situation. Be creative in your proble...
A: Permutation is an arrangement of members in a linear order.
Q: 3. You and a friend are tossing two fair coins. If both coins show heads, you win $2, if both show t...
A: Here X is a winning after single play of game. X takes values $2, $1 and -$1 P(X=$2) = P(HH) = 1/4 =...
Q: 5c. There were 103 data values made available for this problem. This number will be reduced using a ...
A: Introduction: The population has 103 data values, which are assigned serial numbers 1, 2, 3, ..., 10...
Q: How a large sample should be taken to be 95% sure that the error of estimation does not exceed 0.3 u...
A: Givenstandard deviation(σ)=5Margin of error(E)=0.3confidence interval=95%
Q: State the Five Number Summary for the following dataset. 0.03 0.04 0.05 0.07 0.08 0.09 ...
A: given data in ascending order; number of observation(n)=120.03,0.04,0.05,0.07,0.08,0.09,0.11,0.13,0....
Q: if power is 90%, this implies that you have: -a 90% chance of making a type 1 error - a 90% chance o...
A: Type I error: The type I error if the null hypothesis is rejected when it is actually true.
Q: The figures given below are (a) the theoretical trequencies of a distribution, and (b) the frequenci...
A:
Q: 5. The variance on 17 bags of apples is found to be 5.5. The company that bags the apples claims tha...
A:
Q: Attempt the following: (i) P(A) = 0.75, P(B) = 0.50 and P(A U B) = 0.87, are the events A and B inde...
A:
Q: The amount of coffee that people drink per day is normally distributed with a mean of 14 ounces and ...
A: As per bartelby guideline expert have to answer first three subparts only dear student please upload...
Q: (b) (For Math 5090 students) Let X be an nxq data matrix, S its sample covariance matrix and y,, j =...
A: @solution::
Q: Use the table to find the area to the right of t = 1.717 with 22 degrees of freedom. Area to the rig...
A: The value of t statistic is 1.717 with 22 degrees of freedom.
Q: The mean life of a sample of 10 electric light bulbs was found to be 1.456 hours with standard devia...
A:
Q: What is the minimum annual total cost (ordering, holding and purchasing) if the buyer places indepen...
A: Solution: Project X Order size Per per unit Purchase cost of 600 units Ordering cost Carrying cost T...
Q: 4. A box contains 4 green and 2 blue dice. Three dice are chosen one after the other. Determine the ...
A: Given,no.of green dice=4no.of blue dice=2Total no.of dice=6
Q: Using the data in the scatter plot, what is a reasonable slope of a model that fits this data?
A: Here use basic of association and regression


Trending now
This is a popular solution!

Step by step
Solved in 4 steps

- Population Sampling (Quadrat) is usually more effective when the population has an even dispersionClumped dispersion patterns are the least effective. Explain why this would be the case.Question content area Part 1 Aspen Plastics produces plastic bottles to customer order. The quality inspector randomly selects four bottles from the bottle machine and measures the outside diameter of the bottle neck, a critical quality dimension that determines whether the bottle cap will fit properly. The dimensions (in.) from the last six samples are Bottle Sample 1 2 3 4 1 0.576 0.593 0.618 0.580 2 0.580 0.583 0.602 0.586 3 0.571 0.599 0.612 0.578 4 0.570 0.601 0.603 0.594 5 0.596 0.618 0.589 0.571 6 0.610 0.609 0.578 0.605 LOADING... Click the icon to view the table of factors for calculating three-sigma limits for the x-chart and R-chart. Part 2 Suppose that the specification for the bottle neck diameter is 0.600±0.050 in. and the population standard deviation is 0.014 in. a. What is the process capability index? The Cpk is enter your response here. (Enter…Question Two A Deputy Registrar at a certainty university conducted a Chi-Square test of association to establish whether or not employee grade and level of absenteeism were associated. Table 2 below shows part of the results which were obtained. Table 2: Cross tabulation of employee grade and level of absenteeism Contingency Tables Grade LAbsence 1 2 3 Total low Observed 8 1 0 9 Expected 2.90 3.48 2.61 9.00 high Observed 2 11 9 22 Expected 7.10 8.52 6.39 22.00 Total Observed 10 12 9 31 Expected 10.00 12.00 9.00 31.00 2.1 State the appropriate measurement scales for the variables. 2.2 State the null and alternative hypotheses. 2.3 Calculate the expected frequency corresponding to a Grade 3 academic with a high level of absenteeism. 2.4 Find the Chi-Square critical value and test…
- PART D,E,F A researcher wants to compare three different exercise programs. For each program, five volunteers follow it for a month and their weight losses are recorded below. Use a 0.01 significance level to test the claim that the three different exercise programs produce the same mean weight loss Program A: 2.5 8.8 7.3 9.8 5.1 Program B: 5.8 4.9 1.1 7.8 1.2 Program C: 4.3 6.2 5.8 8.1 7.9 a. Define the parameter(s) A. mu 1 equals The mean weight loss by the 5 people on program A mu 2 equals The mean weight loss by the 5 people on program B mu 3 equals The mean weight loss by the 5 people on program C B. mu 1 equals The mean weight loss by all people on program A mu 2 equals The mean weight loss by all people on program B mu 3 equals The mean weight loss by all people on program C C. mu equals The mean weight loss for all people D. p 1 equals The mean…Details: A semiconductor manufacturing process creates an average of 0.4 defects per integrated circuit (chip), with the defects occurring independently of each other.Site image for background. Conduct a test of the null hypothesis H0: u1=u2=u3=u4=u5 by stating (i) a test statistic value, (ii) an associate p-value, (iii) a decision at the a = 0.05 level, and (iv) a conclusion formulated in terms of Ha here for feed rate groups.
- You receive a brochure from a large university. The brochure indicates that the mean class size for full-time faculty is fewer than 3232 students. You want to test this claim. You randomly select 1818 classes taught by full-time faculty and determine the class size of each. The results are shown in the table below. At alphaαequals=0.010.01, can you support the university's claim? Complete parts (a) through (d) below. Assume the population is normally distributed. 3838 3131 2626 3535 3232 4040 2525 2323 2828 2727 3333 3838 3434 2828 2626 3333 2828 2727 (a) Write the claim mathematically and identify Upper H 0H0 and Upper H Subscript aHa. Which of the following correctly states Upper H 0H0 and Upper H Subscript aHa? A. Upper H 0H0: muμequals=3232 Upper H Subscript aHa: muμnot equals≠3232 B. Upper H 0H0: muμless than<3232 Upper H Subscript aHa: muμgreater than or equals≥3232…Nonparametric Tests of Significance – Chi Square (X2) An environmental sociologist is interested in the public’s concern for endangered species. Using the following hypothetical data, test the hypothesis that there is a significant difference between the groups in terms of support for increased protection of marine environments that are home to endangered species. Democrat Republican Independent 23 11 31Part A: S-adenosyl methionine (SAM-e) is a naturally occurring compound in human cells that is thought to have an effect on depression symptoms. Suppose that a researcher is interested in testing SAM-e on patients who are struggling with HIV. She obtains a sample of n = 25 patients and asks each person to take the suggested dosage each day for 4 weeks. At the end of the 4-week period, each individual takes the Beck Depression Inventory (BDI), which is a 21-item, multiple-choice self-report inventory for measuring the severity of depression. The scores from the sample produced a mean of M = 20.8 with a standard deviation of s = 5.18. In the general population of HIV patients, the standardized test is known to have a population mean of μ = 23.2. Because there are no previous studies using SAM-e with this population, the researcher doesn’t know how it will affect these patients; therefore, she uses a two-tailed single-sample t test to test the hypothesis. From the following, select…
- Show supporting work for each section identify the claim & state H0 & Ha select correct choice & fill blanks find critical value(s) z0= identify the rejection region sketch label graph & using greater than or lesser than symbols find standardized test statistic z=decide whether to reject or fail to reject null hypothesis interpret theWhich of the following is NOT considered the assumption about the pattern of heteroscedasticity Select one: The error variance is proportional to the square of the mean value of Y The error variance is proportional to XY The error variance is proportional to X The error variance is proportional to Y Which one of the following is NOT a plausible remedy for near multicollinearity? Select one: Drop one of the collinear variables Use a longer run of data use principle components analysis Take logarithems of each of the variables A sure way of removing multicollinearity from the model is to Select one: Transform the variables by first differencing them Obtaining additional sample data Work with panel data Drop variables that cause multicollinearity in the first place The p value is Select one: the power 2 plus power 2 minimum power none of these The confidence interval constructed for B2 will be same irrespective of the sample analysed. This statement is Select one:…Murder was committed in an air-conditioned laboratory. Dr. Quincy, the medical examiner, was summoned to the scene of the crime. One of the first things he did was to take the temperature of the corpse. At 9:23 PM, he recorded the temperature to be 20.1oC and at 9:53 Pm to be 18.7oC. He further observed that the thermostat of the air-conditioning unit was set at 16oC. After gathering all pertinent data and analyzing them for sometime, he submitted a preliminary report stating that the victim was murdered between 7 PM and 8 PM. Was Dr. Quincy's report correct? At what approximate time did the victim die? Assume that the normal body temperature of a human being, alive and well, is 37oC.

