1. Simple Linear Regression Estimation: (a) For the model y; = B1 + B2x; + Ui, define the fitted value ŷ; and residual û;. (b) x to arrive at estimates for B1 and B2? How does OLS take data on the outcome variable y and the independent variable (c) y on x. Show that the slope coefficient if you regressed y on x* for x B2/a, where a is some constant. To be clear, I want you to show that B = B2/a, where B2 is the OLS estimate of B2 from the model y; = B1 + B2x; + ui, and B is the OLS estimate of B; from the model y; = B+ Bx + u;. Suppose you have the OLS estimate of the slope coefficient B2 from regressing = ax; is equal to
1. Simple Linear Regression Estimation: (a) For the model y; = B1 + B2x; + Ui, define the fitted value ŷ; and residual û;. (b) x to arrive at estimates for B1 and B2? How does OLS take data on the outcome variable y and the independent variable (c) y on x. Show that the slope coefficient if you regressed y on x* for x B2/a, where a is some constant. To be clear, I want you to show that B = B2/a, where B2 is the OLS estimate of B2 from the model y; = B1 + B2x; + ui, and B is the OLS estimate of B; from the model y; = B+ Bx + u;. Suppose you have the OLS estimate of the slope coefficient B2 from regressing = ax; is equal to

College Algebra
7th Edition
ISBN:9781305115545
Author:James Stewart, Lothar Redlin, Saleem Watson
Publisher:James Stewart, Lothar Redlin, Saleem Watson
Chapter1: Equations And Graphs
Section: Chapter Questions
Problem 10T: Olympic Pole Vault The graph in Figure 7 indicates that in recent years the winning Olympic men’s...

Related questions
Question
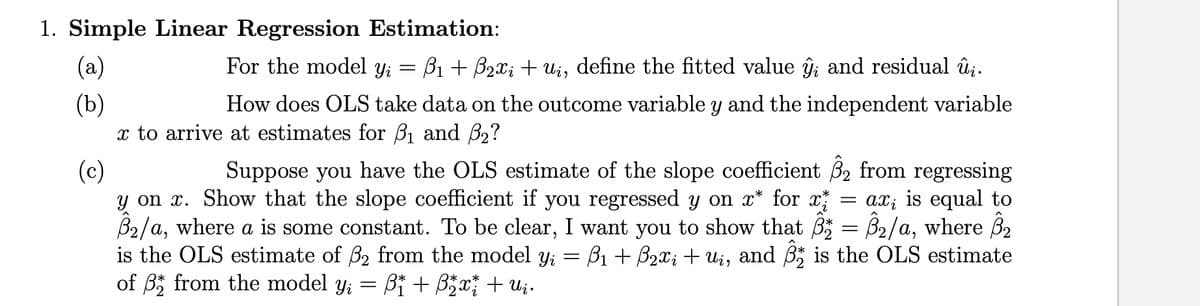
Transcribed Image Text:1. Simple Linear Regression Estimation:
(а)
For the model y;
B1 + B2x; + ui, define the fitted value ĝ; and residual û;.
(b)
x to arrive at estimates for B1 and B2?
How does OLS take data on the outcome variable y and the independent variable
Suppose you have the OLS estimate of the slope coefficient B2 from regressing
ax; is equal to
(c)
y on x. Show that the slope coefficient if you regressed y on x* for x
B2/a, where a is some constant. To be clear, I want you to show that B = B2/a, where B2
is the OLS estimate of B2 from the model Yi = B1 + B2x; + ui, and B is the OLS estimate
of B; from the model y; = Bi + B5x + U;.
Expert Solution
This question has been solved!
Explore an expertly crafted, step-by-step solution for a thorough understanding of key concepts.

Step by step
Solved in 3 steps

Recommended textbooks for you
College Algebra
Algebra
ISBN:
9781305115545
Author:
James Stewart, Lothar Redlin, Saleem Watson
Publisher:
Cengage Learning
College Algebra
Algebra
ISBN:
9781305115545
Author:
James Stewart, Lothar Redlin, Saleem Watson
Publisher:
Cengage Learning