he following histogram represents the number of pages in each book within a collection. What is the frequency of books containing at least 250 but fewer than 400 pages? 2 100 150 200 250 300 350 400 450 Answer: What type of relationship is indicated in the scatterplot? 25 20 15 10 45 60 70 A. No relationship B. A negative linear relationship C. A positive linear relationship D. A positive curvilinear relationship Answer: -- Count
he following histogram represents the number of pages in each book within a collection. What is the frequency of books containing at least 250 but fewer than 400 pages? 2 100 150 200 250 300 350 400 450 Answer: What type of relationship is indicated in the scatterplot? 25 20 15 10 45 60 70 A. No relationship B. A negative linear relationship C. A positive linear relationship D. A positive curvilinear relationship Answer: -- Count

Algebra & Trigonometry with Analytic Geometry
13th Edition
ISBN:9781133382119
Author:Swokowski
Publisher:Swokowski
Chapter7: Analytic Trigonometry
Section7.6: The Inverse Trigonometric Functions
Problem 94E

Related questions
Question
Solve all plzz
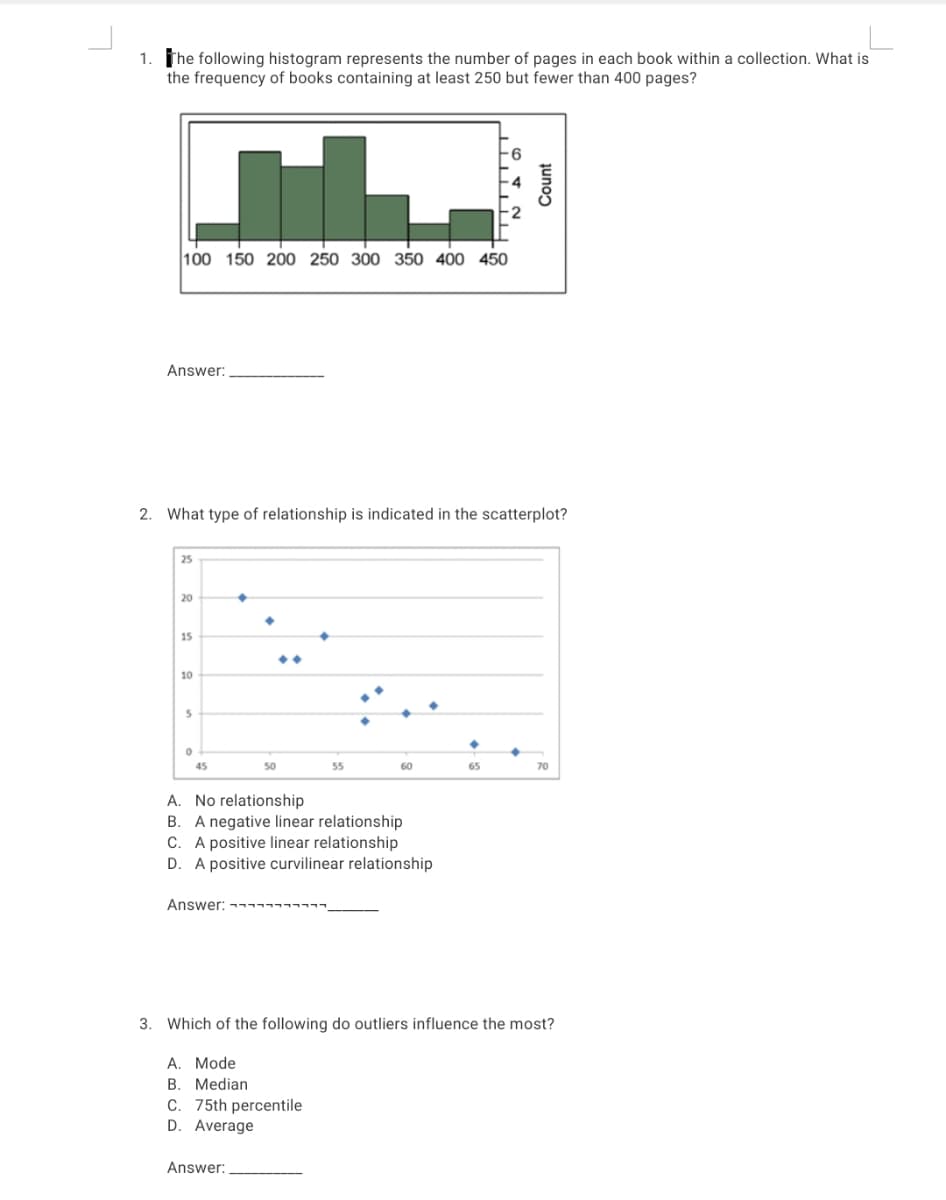
Transcribed Image Text:1. The following histogram represents the number of pages in each book within a collection. What is
the frequency of books containing at least 250 but fewer than 400 pages?
100 150 200 250 300 350 400 450
Answer:
2. What type of relationship is indicated in the scatterplot?
25
20
15
10
45
50
55
60
65
70
A. No relationship
B. A negative linear relationship
C. A positive linear relationship
D. A positive curvilinear relationship
Answer: ---
3. Which of the following do outliers influence the most?
A. Mode
B. Median
C. 75th percentile
D. Average
Answer:
Count
Expert Solution
This question has been solved!
Explore an expertly crafted, step-by-step solution for a thorough understanding of key concepts.

This is a popular solution!

Trending now
This is a popular solution!

Step by step
Solved in 4 steps

Recommended textbooks for you
Algebra & Trigonometry with Analytic Geometry
Algebra
ISBN:
9781133382119
Author:
Swokowski
Publisher:
Cengage

Glencoe Algebra 1, Student Edition, 9780079039897…
Algebra
ISBN:
9780079039897
Author:
Carter
Publisher:
McGraw Hill

Functions and Change: A Modeling Approach to Coll…
Algebra
ISBN:
9781337111348
Author:
Bruce Crauder, Benny Evans, Alan Noell
Publisher:
Cengage Learning
Algebra & Trigonometry with Analytic Geometry
Algebra
ISBN:
9781133382119
Author:
Swokowski
Publisher:
Cengage
Glencoe Algebra 1, Student Edition, 9780079039897…
Algebra
ISBN:
9780079039897
Author:
Carter
Publisher:
McGraw Hill
Functions and Change: A Modeling Approach to Coll…
Algebra
ISBN:
9781337111348
Author:
Bruce Crauder, Benny Evans, Alan Noell
Publisher:
Cengage Learning