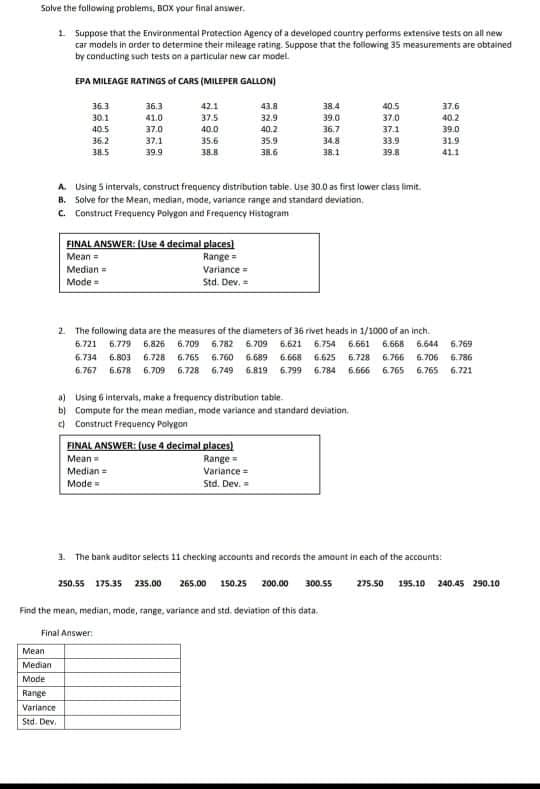
1. Suppose that the Environmental Protection Agency of a developed country performs extensive tests on all new car models in arder to determine their mileage rating. Suppose that the following 35 measurements are obtained by conducting such tests on a particular new car model. EPA MILEAGE RATINGS of CARS (MILEPER GALLON) 36.3 36.3 42.1 43.8 38.4 40.5 37.6 30.1 41.0 37.5 32.9 39.0 37.0 40.2 40.5 37.0 40.0 40.2 36.7 37.1 39.0 36.2 37.1 35.6 35.9 34.8 33.9 31.9 38.5 39.9 38.8 38.6 36.1 39.8 41.1 A Using 5 intervals, construct frequency distribution table. Use 30.0 as first lower clas limit. B. Solve for the Mean, median, mode, variance range and standard deviation, C. Construct Frequency Polygon and Frequency Histogram FINAL ANSWER: (Use 4 decimal places) Mean Range= Median Variance Mode Std. Dev,
1. Suppose that the Environmental Protection Agency of a developed country performs extensive tests on all new car models in arder to determine their mileage rating. Suppose that the following 35 measurements are obtained by conducting such tests on a particular new car model. EPA MILEAGE RATINGS of CARS (MILEPER GALLON) 36.3 36.3 42.1 43.8 38.4 40.5 37.6 30.1 41.0 37.5 32.9 39.0 37.0 40.2 40.5 37.0 40.0 40.2 36.7 37.1 39.0 36.2 37.1 35.6 35.9 34.8 33.9 31.9 38.5 39.9 38.8 38.6 36.1 39.8 41.1 A Using 5 intervals, construct frequency distribution table. Use 30.0 as first lower clas limit. B. Solve for the Mean, median, mode, variance range and standard deviation, C. Construct Frequency Polygon and Frequency Histogram FINAL ANSWER: (Use 4 decimal places) Mean Range= Median Variance Mode Std. Dev,

Mathematics For Machine Technology
8th Edition
ISBN:9781337798310
Author:Peterson, John.
Publisher:Peterson, John.
Chapter34: Customary Micrometers
Section: Chapter Questions
Problem 67A

Related questions
Question
Transcribed Image Text:Solve the following problems, BOX your final answer.
1. Suppose that the Environmental Protection Agency of a developed country performs extensive tests on all new
car models in order to determine their mileage rating. Suppose that the following 35 measurements are obtained
by conducting such tests on a particular new car model.
EPA MILEAGE RATINGS of CARS (MILEPER GALLON)
36.3
36.3
42.1
43.8
38.4
40.5
37.6
30.1
41.0
375
32.9
39.0
37.0
40.2
40.5
37.0
40.0
40.2
36.7
37.1
39.0
36.2
37.1
35.6
359
34.8
33.9
31.9
38.5
39.9
38.8
38.6
38.1
39.8
41.1
A Using 5 intervals, construct frequency distribution table. Use 30.0 as first lower class limit.
8. Solve for the Mean, median, mode, variance range and standard deviation.
C. Construct Frequency Polygon and Frequency Histogram
FINAL ANSWER: (Use 4 decimal places)
Mean =
Range=
Median=
Variance =
Mode =
Std. Dev. =
2. The following data are the measures of the diameters of 36 rivet heads in 1/1000 of an inch.
6.721 6.779 6,826 6.709 6. 782 6.709 6.621 6.754 6.66l 6.668 6.644 6.769
6.734
6.803 6.728 6.765 6.760 6.689 6.668 6.625 6.728 6.766 6.706 6.786
6.767
6.678 6.709 6.728 6,749 6.819 6.799 6.784 6.666 6.765 6.765 6.721
a) Using 6 intervals, make a frequency distribution table.
b) Compute for the mean median, mode variance and standard deviation.
e Construct Frequency Polygon
FINAL ANSWER: (use 4 decimal places)
Mean
Range=
Variance =
Median =
Mode =
Std. Dev.
1. The bank auditor selects 11 checking accounts and records the amount in each of the accounts:
250.55 175.35 235.00
265.00 150.25 200.00 300.55
275.50 195.10 240.45 290.10
Find the mean, median, made, range, variance and std. deviation of this data,
Final Answen
Mean
Median
Mode
Range
Variance
Std. Dev.
Expert Solution
This question has been solved!
Explore an expertly crafted, step-by-step solution for a thorough understanding of key concepts.

This is a popular solution!

Trending now
This is a popular solution!

Step by step
Solved in 9 steps with 16 images

Recommended textbooks for you
Mathematics For Machine Technology
Advanced Math
ISBN:
9781337798310
Author:
Peterson, John.
Publisher:
Cengage Learning,
Mathematics For Machine Technology
Advanced Math
ISBN:
9781337798310
Author:
Peterson, John.
Publisher:
Cengage Learning,