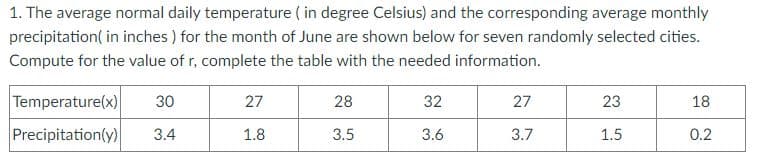
1. The average normal daily temperature ( in degree Celsius) and the corresponding average monthly precipitation( in inches ) for the month of June are shown below for seven randomly selected cities. Compute for the value of r, complete the table with the needed information. Temperature(x) 30 27 28 32 27 23 18 Precipitation(y) 3.4 1.8 3.5 3.6 3.7 1.5 0.2


Q: The distribution of number of stores according to size in 3 areas is given in the following table:…
A: In probability, we say two events are independent if knowing one event occurred doesn't change the…
Q: In two towns A and B, the following information was supplied by an investigator Total population (in…
A:
Q: 4. The average normal daily temperature (in degree Celsius) and the corresponding average monthly…
A: given the average normal daily temperature and the corresponding average monthly precipitation for…
Q: . For a population with u = 40 and o = 5, compute the z-score corresponding to each of the following…
A: Hello! As you have posted more than 3 sub parts, we are answering the first 3 sub-parts. In case…
Q: 7. Find the Q.D. and coefficient of Q.D. from the following data. auou Size Frequency 3.5 4.5 5.5…
A:
Q: Let x be the percentage of 16- to 19-year-olds not in school and not high school graduates. Let y be…
A:
Q: Following are age and price data for 8 randomly selected ambulances between 1 and 6 years old. Here,…
A: Solution: Given information: n= 8 observation ∑x=32∑y=2560∑xy=9460∑x2=158∑y2= 840900
Q: 1.The manager of an auto dealership would like to develop a model the fuel consumption of various…
A: Given data represents fuel consumption of various car models based on engine size. Here, The…
Q: 8 The following are the number of minutes it takes 10 typists to finish a piece of secretarial work…
A: Scatter plot: A Scatter plot is a non-mathematical representation of data, that shows the degree of…
Q: Draw a scatter diagram and find r for the data shown in the table. (Round r to three decimal…
A: Given data,
Q: Archie is fed up with waiting in line at his local post office, and plans to contact his…
A: Calculate Mean from the following grouped data Class Frequency 0 - 6 2 7 - 13 9 14 - 20 5…
Q: 7. Find the Q.D. and coefficient of Q.D. from the following data. Size Frequency 3.5 4.5 5.5 6.5 5 7…
A: Given that X Frequency 3.5 5 4.5 7 5.5 22 6.5 60 7.5 85 8.5 32 9.5 8
Q: 12. Compute the amount of information and the redundancy of the following data presented in the…
A:
Q: For a population with u = 100 and o = 20, what is the X value corresponding to z = 1.50? O 130 O 30…
A:
Q: 3. The data collected on 10 college students were shown below, X is the number of hours the subject…
A: For the given data Find all the required
Q: 4. For a population with u= 100 and o = 20, what is the X value corresponding to z=- 0.75?
A: GivenMean(μ)=100standard deviation(σ)=20z=-0.75
Q: Let x be the percentage of 16- to 19-year-olds not in school and not high school graduates. Let y be…
A: Solution: x y x2 y2 xy 24.3 13 590.49 169 315.9 19.2 4.6 368.64 21.16 88.32 18.3 9.1…
Q: Montgomery, Peck, and Vining (2o01) present data concerning the performance of the 28 National…
A: There are 28 teams. So, n = 28. The given data of X and Y is: x y 2205 10 2096 11 1847 11…
Q: 29. Eleven cities are ranked according the their pollution levels and occurrence of pulmonary…
A:
Q: A random sample of 11 professional athletes produced the following data, where a is the number of…
A: Solution: n= 11 observation α=0.08 Level of significance Claim : To determine whether or not…
Q: A sample of size n = 10 has a mean z = 13.5. If Y = x + 3, then the mean of Y is O 16.5 O 10 O 3 O…
A:
Q: 4. The ages of students in a night class on gerontology were collected with the following results: X…
A: Confidence interval: The following is the formula for Confidence interval about true population…
Q: (a) Compute E(Y). E(Y) = (b) Suppose an individual with Y violations incurs a surcharge of $90Y2.…
A: 1) It is given that the random variable Y denote the number of moving violations for which the…
Q: 1. The average normal daily temperature ( in degree Celsius) and the corresponding average monthly…
A: Here data is given : We have to calculate r value and regression equation, slope of regression line,…
Q: 1. The average normal daily temperature ( in degree Celsius) and the corresponding average monthly…
A: Given data is Temperature(x) 30 27 28 32 27 23 18 Precipitation(y) 3.4 1.8 3.5 3.6 3.7 1.5 0.2
Q: 6. Given the following pairs of corresponding values of X and Y: X: 20 25 30 35 40 Y: 73 198 573…
A: We have given that, The pairs of corresponding values of X and Y are :- X :- 20, 25, 30,…
Q: Let x be the percentage of 16- to 19-year-olds not in school and not high school graduates. Let y be…
A: Note- Hey there! As per our policy we can answer only the first 3 sub-parts of a question. Please…
Q: Given that n=82 data points are collected when studying the relationship between average daily…
A: It is given that sample size (n) is 82, and r is -0.974.Thus,The degree of freedom (df) is:
Q: 2. For a population with u = 40 and o = 5, compute the z-score corresponding to each of the…
A: Given data,μ=40σ=5
Q: Complete the following table to compare men and women using data collected at the first examination…
A: Given:
Q: a) Use the forward, backward and centr al difference interpolation formulas to predict y values at…
A:
Q: A. Compute the z for each given the following 1. Claimed proportion = 0.2, Sample proportion = 0.18,…
A: Given that Q3) claimed proportion=0.66; p=0.66 sample proportion=0.61;p^=0.61 Sample size =40; n=40…
Q: For a population with u = 50 and o = 10, a score of X= 55 corresponds to z = +0.50. %3D True False
A: The z-score of a random variable x is defined as follows: z = (x – µ)/σ. Here, µ and σ are the mean…
Q: An economist is studying the job market in Denver area neighborhoods. Let x represent the total…
A: Solution-: Let, X=the total number of jobs in a given neighborhood and Y=the number of entry-level…
Q: Given are data on average food consumption (g / kg body wt) of groups of tilapia , Oreochromis…
A: Whenever we want to study the difference between the average values of same subject…
Q: The following are sample data provided by a moving company on the weights of six shipments, the…
A: See the attachment...
Q: Following are age and price data for 8 randomly selected ambulances between 1 and 6 years old. Here,…
A:
Q: An economist is studying the job market in Denver area neighborhoods. Let x represent the total…
A: (a) Scatter diagram for the given data is constructed below: Steps to construct scatter plot:…
Q: For a population with u=50 and o=10,what is the x value corresponding to z=0.4?
A: Given: Population mean = mu = 50 population standard deviation = sigma = 10 Z = 0.4
Q: The following table shows how many weeks a sample of 6 persons have worked at an automobile…
A: a) Least square equation: Excel Procedure: Enter X and Y data in Excel Go to Data Click on Data…
Q: Suppose that the students just completing freshman year at Galton University have Math SAT scores…
A: Introduction: It is mentioned that the scatterplot of the two variables is in an oval-shaped cloud…
Q: The distribution of number of stores according to size in 3 areas is given in the following table:…
A: Since you have posted a question with multiple sub-parts, we will solve first three subparts for…
Q: An economist is studying the job market in Denver area neighborhoods. Let x represent the total…
A:
Q: A survey of 2,510 golfers showed that 311 of them are left-handed. Find a point estimate for p,…
A:
Q: The data below are the termperatures on randomly chosen days during a summer class and the number of…
A: Solution-: Let, X=Temperature and Y=Number of absences We have following table: X Y 72 3 85 7…
Q: The following table consists of one student athlete's time, x, (in minutes) to swim 2,500 yards and…
A: Given - x is athlete's time (in minutes) to swim 2,500 yards y is heart rate (beats per minute)
Q: For a population with u = 62 and o = 12, find the X value that corresponds to each of the following…
A: Given: Population mean μ=62 Population standard deviation σ=12 The z score is z=X-μσ
Q: The average normal daily temperature ( in degree Celsius) and the corresponding average monthly…
A:
Q: Consider the following data relating hours spent studying (X) and average grade on course quizzes…
A: The data shows the hours spent studying and average grade on course quizzes.
Q: Let x be the percentage of 16- to 19-year-olds not in school and not high school graduates. Let y be…
A: Consider the calculations given below: In an empty cell of an Excel sheet, type…
Directions: Solve the following problems carefully. After solving for the r-value find also
a.) slope of the regression line,
b.) the intercept of the regression line,
c.) the general equation for simple regression,
d.) graph the regression line.


Trending now
This is a popular solution!

Step by step
Solved in 2 steps with 2 images

- The average normal daily temperature ( in degree Celsius) and the corresponding average monthly precipitation( in inches ) for the month of June are shown below for seven randomly selected cities. Compute for the value of r, complete the table with the needed information. Temperature(x) 30 27 28 32 27 23 18 Precipitation(y) 3.4 1.8 3.5 3.6 3.7 1.5 0.222 - It is desired to investigate the difference between the satisfaction rates of the customers in different hotels of the same establishment in a region. 1000 out of 1200 randomly selected customers in Hotel A and 1200 of 1500 randomly selected customers in Hotel B stated that they were satisfied with the hotel services. Which of the following is the point estimate of the difference in customer dissatisfaction rates between hotels A and B? a) 0.03 B) 0.08 NS) 0.067 D) -0.067 TO) -0.034. For a sample of 12 observations, a businessman wants to regress the price (in dollar) of the laptop (Y) on the processor's speed (X). The summary results of the observations are given below. Σx = 19.8 , Σy = 24798, Σxy = 431882 Σx^2 = 3388, Σγ^2 = 57365692 (c) Find the predicted price of the laptop (y) for the processor speed x-1.9. (d) Compute the coefficient of determination and comment.
- 1. Find the percentage of N.d. observations with a zz-score between z1= -3.04 and z2 = 2.85. Give your answer to two decimal places. 2. Find the proportion of N.d. observations with a zz-score between z1= -2.95 and z2 = 0.70. Give your answer to four decimal places.A random sample of n1 = 16 winter days in Denver gave a sample mean pollution index x1 = 43. Previous studies show that ?1 = 15. For Englewood (a suburb of Denver), a random sample of n2 = 14 winter days gave a sample mean pollution index of x2 = 37. Previous studies show that ?2 = 17. Assume the pollution index is normally distributed in both Englewood and Denver. Do these data indicate that the mean population pollution index of Englewood is different (either way) from that of Denver in the winter? Use a 1% level of significance. (a) What is the level of significance? State the null and alternate hypotheses. H0: ?1 < ?2; H1: ?1 = ?2H0: ?1 = ?2; H1: ?1 > ?2 H0: ?1 = ?2; H1: ?1 ≠ ?2H0: ?1 = ?2; H1: ?1 < ?2 (b) What sampling distribution will you use? What assumptions are you making? The standard normal. We assume that both population distributions are approximately normal with unknown standard deviations.The standard normal. We assume that both population…A random sample of n1 = 12 winter days in Denver gave a sample mean pollution index x1 = 43. Previous studies show that ?1 = 15. For Englewood (a suburb of Denver), a random sample of n2 = 16 winter days gave a sample mean pollution index of x2 = 37. Previous studies show that ?2 = 11. Assume the pollution index is normally distributed in both Englewood and Denver. Do these data indicate that the mean population pollution index of Englewood is different (either way) from that of Denver in the winter? Use a 1% level of significance. What is the value of the sample test statistic? (Test the difference ?1 − ?2. Round your answer to two decimal places.)=__ (c)Find (or estimate) the P-value. (Round your answer to four decimal places.=__
- A random sample of n1 = 14 winter days in Denver gave a sample mean pollution index x1 = 43. Previous studies show that ?1 = 13. For Englewood (a suburb of Denver), a random sample of n2 = 10 winter days gave a sample mean pollution index of x2 = 35. Previous studies show that ?2 = 11. Assume the pollution index is normally distributed in both Englewood and Denver. Do these data indicate that the mean population pollution index of Englewood is different (either way) from that of Denver in the winter? Use a 1% level of significance. what is the sample test statistic find or estimate p value2- An expert estimates that the distribution parameter for durability times of parts produced with machine A in the factory is different from the distribution parameter for durability times of parts produced with machine B. Durability times of 4 parts produced from machine A and 4 parts produced from machine B are given below. Find the Mann-Whitney U value by using these data. a) 18 B) 6 NS) 16 D) 20 TO) 12A random sample of n1 = 20 winter days in Denver gave a sample mean pollution index x1 = 43. Previous studies show that ?1 = 11. For Englewood (a suburb of Denver), a random sample of n2 = 18 winter days gave a sample mean pollution index of x2 = 36. Previous studies show that ?2 = 15. Assume the pollution index is normally distributed in both Englewood and Denver. Do these data indicate that the mean population pollution index of Englewood is different (either way) from that of Denver in the winter? Use a 1% level of significance. a) What is the value of the sample test statistic? (Test the difference ?1 − ?2. Round your answer to two decimal places.)b) Find (or estimate) the P-value. (Round your answer to four decimal places.)
- A vending machine company wants to check three of its machines to determine if they are properly dispensing 12 ounces of coffee. Test by using α=0.05. Their data is given below. Machine A Machine B Machine C 11.8 11.7 12.2 12.1 11.9 12.1 12.0 11.7 12.0 11.9 11.8 11.9 12.1 12.0 12.2 Group of answer choices There is sufficient evidence to reject the claim that the proportions are equal because the p-value 0.0255 < 0.05 There is insufficient evidence to conclude the claim that the proportions are equal because the p-value 0.0255 < 0.05 There is insufficient evidence to reject the claim that the proportions are equal because the p-value 0.0255 < 0.05 There is sufficient evidence to conclude the claim that the proportions are equal because the p-value 0.0255 < 0.05A random sample of n1 = 20 winter days in Denver gave a sample mean pollution index x1 = 43. Previous studies show that σ1 = 11. For Englewood (a suburb of Denver), a random sample of n2 = 15 winter days gave a sample mean pollution index of x2 = 49. Previous studies show that σ2 = 16. Assume the pollution index is normally distributed in both Englewood and Denver. Do these data indicate that the mean population pollution index of Englewood is different (either way) from that of Denver in the winter? Use a 1% level of significance. (a) What is the level of significance? What is the value of the sample test statistic? (Test the difference μ1 − μ2. Round your answer to two decimal places.)(c) Find (or estimate) the P-value. (Round your answer to four decimal places.)A random sample of n1 = 20 winter days in Denver gave a sample mean pollution index x1 = 43. Previous studies show that σ1 = 11. For Englewood (a suburb of Denver), a random sample of n2 = 10 winter days gave a sample mean pollution index of x2 = 31. Previous studies show that σ2 = 18. Assume the pollution index is normally distributed in both Englewood and Denver. Do these data indicate that the mean population pollution index of Englewood is different (either way) from that of Denver in the winter? Use a 1% level of significance. (a) What is the level of significance? State the null and alternate hypotheses. H0: μ1 < μ2; H1: μ1 = μ2H0: μ1 = μ2; H1: μ1 > μ2 H0: μ1 = μ2; H1: μ1 ≠ μ2H0: μ1 = μ2; H1: μ1 < μ2 (b) What sampling distribution will you use? What assumptions are you making? The standard normal. We assume that both population distributions are approximately normal with unknown standard deviations.The Student's t. We assume that both population…
